Development Status Analysis Donut Graph – Visualizing Competitive Advantage
RJ0300063_19
- Last Update 05/05/2025
- File Size 4.3MB
- # of Slides 2
- File Format PPTX
- Slide Ratio 16:9
- Color
Keywords
- #Content-Based Slides
- #Design-Based Slides
- #Product/Service Introduction
- #Market and Competitor Analysis
- #Graph
- #Development Status
- #Competitive Advantage
- #Circles
- #Doughnut Chart
- #16:9
- #donut chart PowerPoint
- #pie chart slide template
- #development status analysis presentation
- #competitive analysis diagram
- #3-layer data visualization slide
About the Product
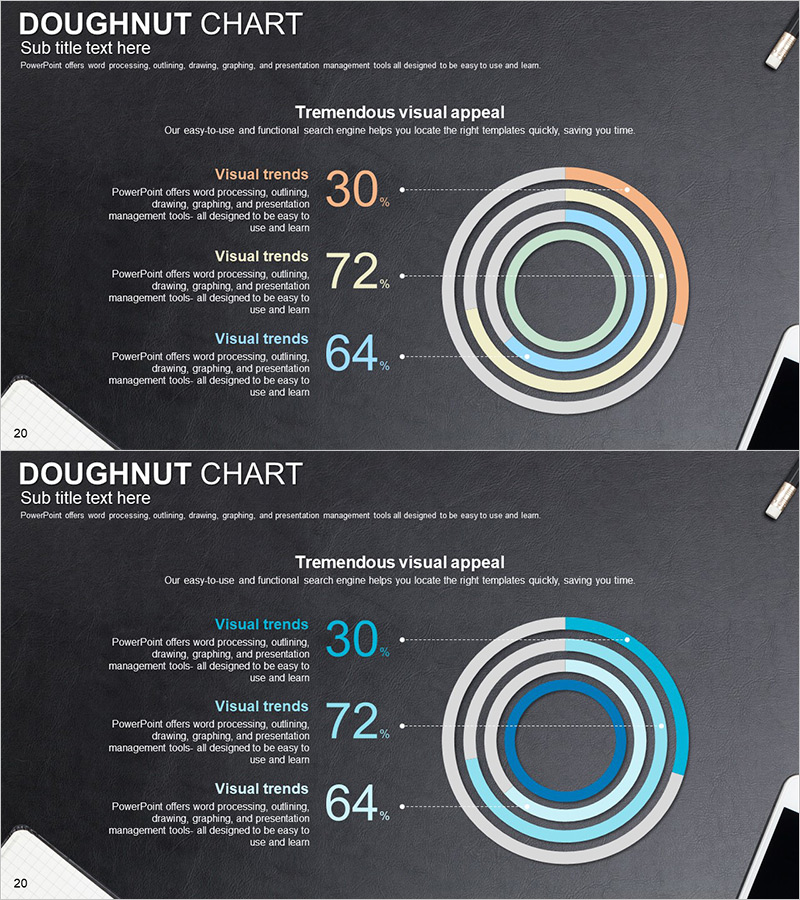
A 3-layer donut chart PowerPoint slide designed to visualize development progress and competitive positioning. The dark background features concentric rings in orange, blue, and green tones, enabling hierarchical data representation with left-aligned text areas for metrics and descriptions. The 2-slide set accommodates diverse data combinations and works effectively in presentations, reports, and strategic planning documents to communicate complex indicators clearly. Provided in fully editable PPTX format for immediate customization.
Usage Points
-
Main Usage
Optimized for expressing and comparing three or more hierarchical data sets simultaneously, such as development progress rates, market share, or competitor benchmarking. The hollow center of the donut allows emphasis of key metrics or titles, while color differentiation across layers clarifies information hierarchy.
-
How to Use
Input category names and values in the left text area for each layer, then adjust the donut chart colors and proportions to match your data. During presentations, explain each layer sequentially or display the complete structure for side-by-side comparison. Use the 2-slide set to present different data sets or illustrate changes over time.
-
Recommended For
Ideal for strategy teams, marketing departments, development teams, and executive reporting. Recommended for business status analysis, market competitiveness assessment, product development progress tracking, and customer segmentation analysis presentations.
-
Slide Structure
2-slide set with each slide featuring a 3-layer concentric donut chart and left-aligned text area. Layout includes title section at top, centered donut visualization (orange, blue, green palette), and three text boxes on the left (metrics + descriptions). Optimized for 16:9 widescreen format.
Related Products
-

Transportation Services Competitive Advantage Comparison Graph
#Product/Service Introduction #Market and Competitor Analysis #Diagram
-

Status Donut Chart Slide – A Powerful Tool for Data Analysis
#Product/Service Introduction #Market and Competitor Analysis #Graph
-

Camera Donut Chart and Table – Market and Competitive Analysis
#Product/Service Introduction #Market and Competitor Analysis #Graph
-

User Experience Advantage Analysis Chart – Visualizing Competitive Edge
#Product/Service Introduction #Market and Competitor Analysis #Diagram
