Marketing Cost Operating Plan – Enhance Financial Planning Efficiency
RM0400009_29
- Last Update 02/17/2025
- File Size 0.6MB
- # of Slides 2
- File Format PPTX
- Slide Ratio 16:9
- Color
Keywords
- #Content-Based Slides
- #Design-Based Slides
- #Business Strategy
- #Financial Plans and Performance
- #Diagram
- #Income Statement
- #Table
- #16:9
- #marketing cost table PowerPoint
- #operating plan slide template
- #financial planning presentation
- #budget management table PPT
- #how to create marketing budget in PowerPoint
About the Product
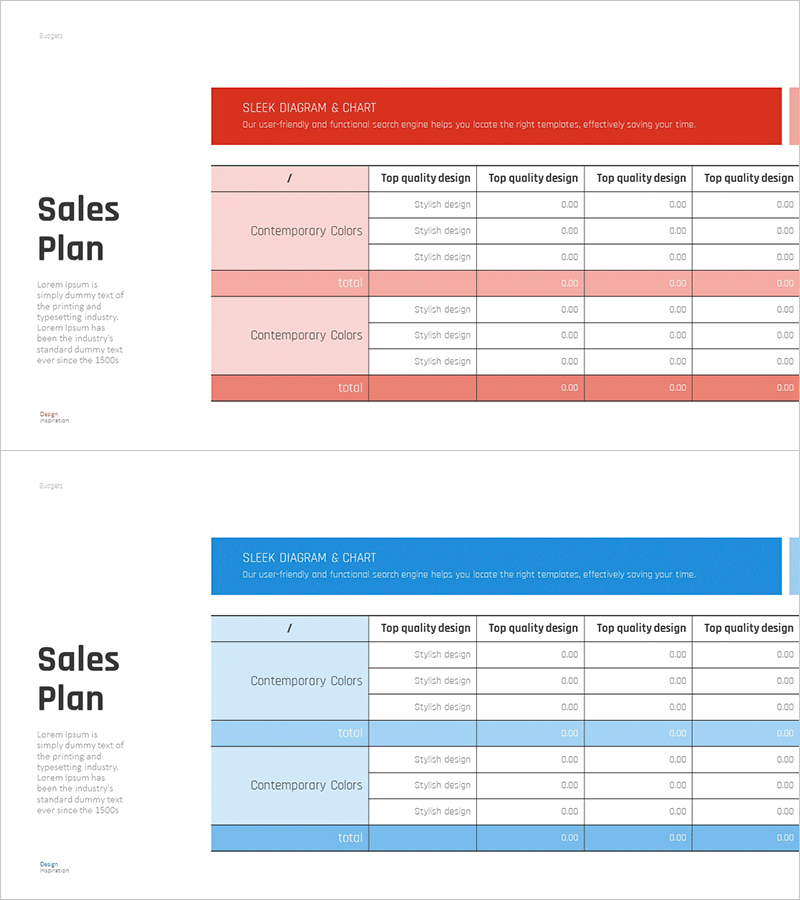
Marketing Cost Operating Plan PowerPoint slide designed to enhance financial planning efficiency and budget tracking. This presentation template features two color variations—red and blue—enabling clear visual comparison of marketing expenses across categories. Each slide includes structured rows for cost items, style design options, and numerical input fields, with a total row for quick budget overview. The table layout supports easy data entry and professional presentation in marketing planning documents, business proposals, and financial reports. Fully editable and ready for immediate use in executive presentations and budget reviews.
Usage Points
-
Main Usage
Present monthly and quarterly marketing expenses in a structured format to executives and stakeholders. Compare budgeted versus actual costs across departments and time periods to support data-driven financial decision-making.
-
How to Use
Enter marketing cost categories (advertising, events, personnel) and corresponding figures into the table cells. Select red or blue color scheme to differentiate comparison periods or budget scenarios. The total row automatically calculates aggregate spending when formulas are applied.
-
Recommended For
Marketing managers, finance directors, CFOs, and business analysts presenting budget reviews, quarterly performance reports, and financial forecasts. Suitable for startups, SMEs, and enterprise-level organizations requiring professional cost tracking presentations.
-
Slide Structure
Header section with diagram and chart description, left column for cost categories, central data input area with style options and numerical fields, right columns for quarterly or comparative data (4 columns), and bottom total row for aggregate budget summary.
Related Products
-

Fantastic Wide PPT Table – Detailed Financial Planning & Performance
#Financial Plans and Performance #Diagram #Income Statement
-

Geometry Pattern Wide Table PPT Template for Financial Planning and Performance
#Financial Plans and Performance #Diagram #Balance Sheet
-

Vibrant Paint Splash Table Slide – Financial Performance at a Glance
#Financial Plans and Performance #Diagram #Income Statement
-

Table of Key Financial Indicators to Highlight
#Financial Plans and Performance #Diagram #Income Statement
