Pentagon Diagram & Table Chart – Market Analysis and Competitive Insight
RM0400007_7
- Last Update 02/16/2025
- File Size 0.4MB
- # of Slides 2
- File Format PPTX
- Slide Ratio 16:9
- Color
Keywords
- #Content-Based Slides
- #Design-Based Slides
- #Market and Competitor Analysis
- #Diagram
- #Market Analysis
- #Market Overview
- #Cluster
- #Table
- #Chain Diagram
- #Standard Table
- #16:9
- #pentagon diagram PowerPoint
- #table chart slide template
- #market analysis presentation
- #competitive analysis PPT
- #5-item comparison diagram
About the Product
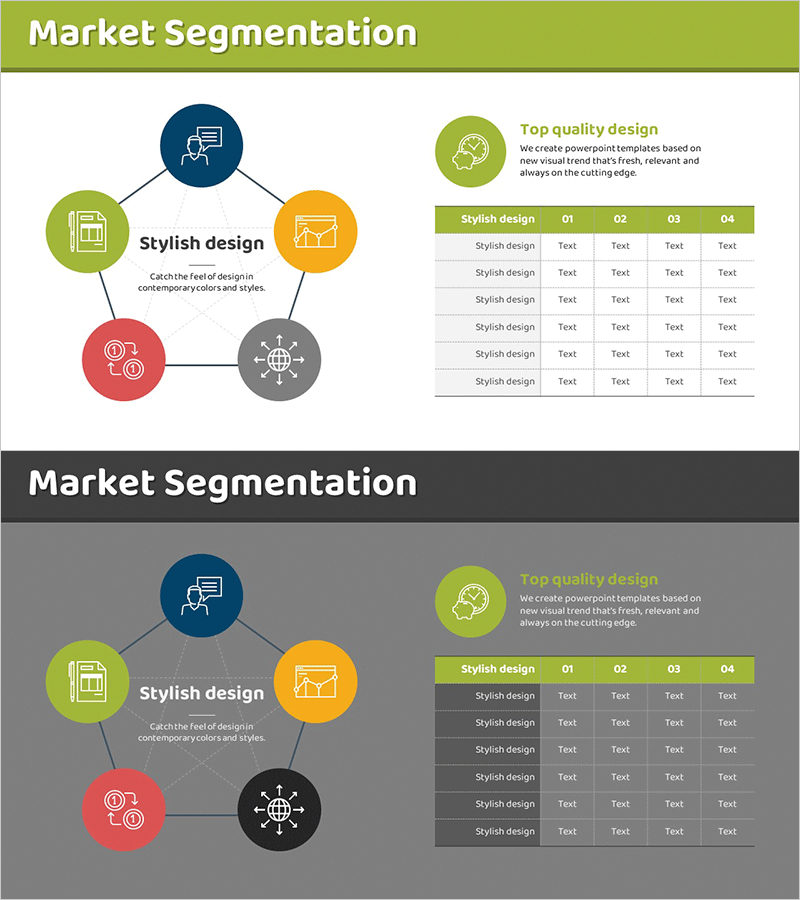
A 2-slide PowerPoint template optimized for market analysis and competitive positioning. The first slide features a radial pentagon diagram with five colored nodes (lime, orange, navy, red, gray) arranged around a central 'Stylish design' label, each containing an icon and descriptive text to visualize market segmentation. The second slide presents a comparison table with a lime header row and gray data rows, structured as 5 rows × 5 columns to compare five stylish design variants (01–04) across multiple dimensions. Delivered in 16:9 widescreen PPTX format, fully editable and ready for marketing strategy, business analysis, and competitive insight presentations.
Usage Points
-
Main Usage
Visualizes market segmentation, competitive positioning, and five-element comparison analysis at a glance. The pentagon diagram's symmetric structure emphasizes equal importance of each element, while the table chart supports detailed version-by-version and item-by-item comparison.
-
How to Use
Insert into marketing strategy presentations, business analysis reports, and product positioning decks in the market segmentation section. Replace pentagon text and icons with your analysis categories, populate the table with your data, and deploy immediately as presentation material.
-
Recommended For
Marketing managers, strategy planners, executives, consultants, and business analysts explaining market analysis, competitive analysis, and positioning strategies. Particularly effective when balanced comparison of five elements is required.
-
Slide Structure
Slide 1: Five colored pentagon nodes (lime, orange, navy, red, gray) arranged radially around central text, each containing an icon. Slide 2: Comparison table with lime header (Stylish design 01–04) and five gray data rows, 5×5 structure with 25 editable text fields.
Related Products
-

Market Trend Analysis Charts & Tables – The Power of Data Visualization
#Market and Competitor Analysis #Diagram #Graph
-

Market Segmentation Linkage Diagram - Market Analysis and Insights
#Market and Competitor Analysis #Diagram #Market Analysis
-

Detailed Analysis in Book Illustration PowerPoint Template
#Market and Competitor Analysis #Diagram #Graph
-

Market Analysis Donut Chart & Table Slide
#Market and Competitor Analysis #Diagram #Graph
