Market Segmentation Linkage Diagram - Market Analysis and Insights
RM0400006_7
- Last Update 02/16/2025
- File Size 1MB
- # of Slides 2
- File Format PPTX
- Slide Ratio 16:9
- Color
Keywords
- #Content-Based Slides
- #Design-Based Slides
- #Market and Competitor Analysis
- #Diagram
- #Market Analysis
- #Market Overview
- #Cluster
- #Table
- #Chain Diagram
- #16:9
- #market segmentation diagram
- #linkage diagram PowerPoint
- #market analysis slide
- #competitive analysis presentation
- #marketing strategy diagram
- #5-node hub PowerPoint
- #how to create market segmentation in PowerPoint
About the Product
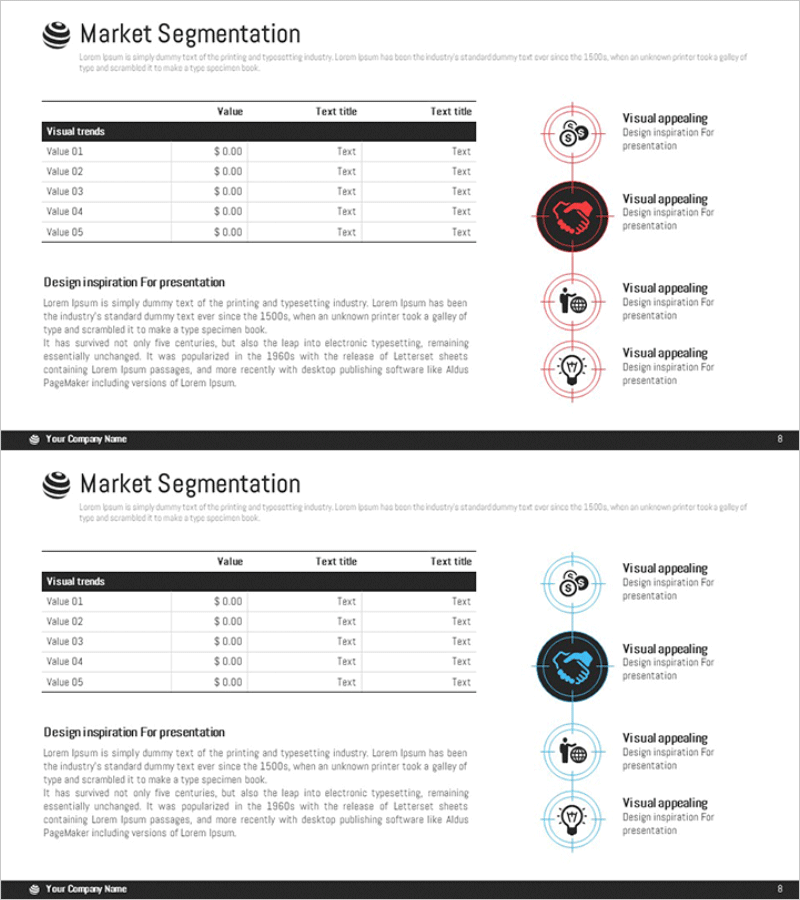
A linkage diagram PowerPoint slide designed for market segmentation analysis. The 5-node hub-and-spoke structure radiates from a central concept to represent key marketing elements such as market analysis, competitive analysis, customer segmentation, pricing strategy, and distribution channels. The design uses black, red, and gray tones with circular nodes and icons to clearly express information hierarchy. Provided in 16:9 widescreen format across 2 slides in editable PPTX format. Ready to use in business presentations, strategic planning documents, and market analysis reports.
Usage Points
-
Main Usage
Visualize complex market segmentation strategy and marketing analysis elements through a hub-and-spoke structure that radiates from a central concept to surrounding nodes. Enables executives, marketing teams, and strategic planners to communicate market analysis findings with clarity and persuasion.
-
How to Use
Insert into the market analysis section of business plans, strategic reports, or executive presentations. Edit node text to reflect actual analysis categories such as customer segments, geographic regions, price tiers, or distribution channels. Customize icons and colors to align with corporate branding and presentation style.
-
Recommended For
Ideal for marketing strategists, business consultants, product development teams, and market research professionals presenting segmentation strategies. Particularly effective in new business proposals, marketing strategy presentations, competitive analysis reports, and investor pitch decks.
-
Slide Structure
Two-slide set featuring a hub-and-spoke linkage diagram with a central circular node connected to 5 surrounding nodes. Black header bar at top contains title and descriptive text. Data input table positioned at bottom for numerical values. Optimized for 16:9 widescreen format in modern presentation environments.
Related Products
-

Pentagon Diagram & Table Chart – Market Analysis and Competitive Insight
#Market and Competitor Analysis #Diagram #Market Analysis
-

Red Ratio Horizontal Bar Graph – Market Analysis and Trends
#Market and Competitor Analysis #Diagram #Graph
-

Performance Analysis with Donut Chart and Table
#Market and Competitor Analysis #Diagram #Graph
-

Market Overview Analysis Slides – Insights & Data at a Glance
#Market and Competitor Analysis #Diagram #Market Analysis
