Market Segmentation Square Overlay Diagram – Analysis and Insight
RM0400003_7
- Last Update 02/15/2025
- File Size 3.6MB
- # of Slides 2
- File Format PPTX
- Slide Ratio 16:9
- Color
Keywords
- #Content-Based Slides
- #Design-Based Slides
- #Product/Service Introduction
- #Market and Competitor Analysis
- #Diagram
- #Composition
- #Market Analysis
- #Structure
- #Cluster
- #Tree Diagram
- #Combination Diagram
- #16:9
- #square overlay diagram PowerPoint
- #market segmentation slide template
- #3-level hierarchy diagram
- #nested shape PPT slide
- #layered structure visualization
About the Product
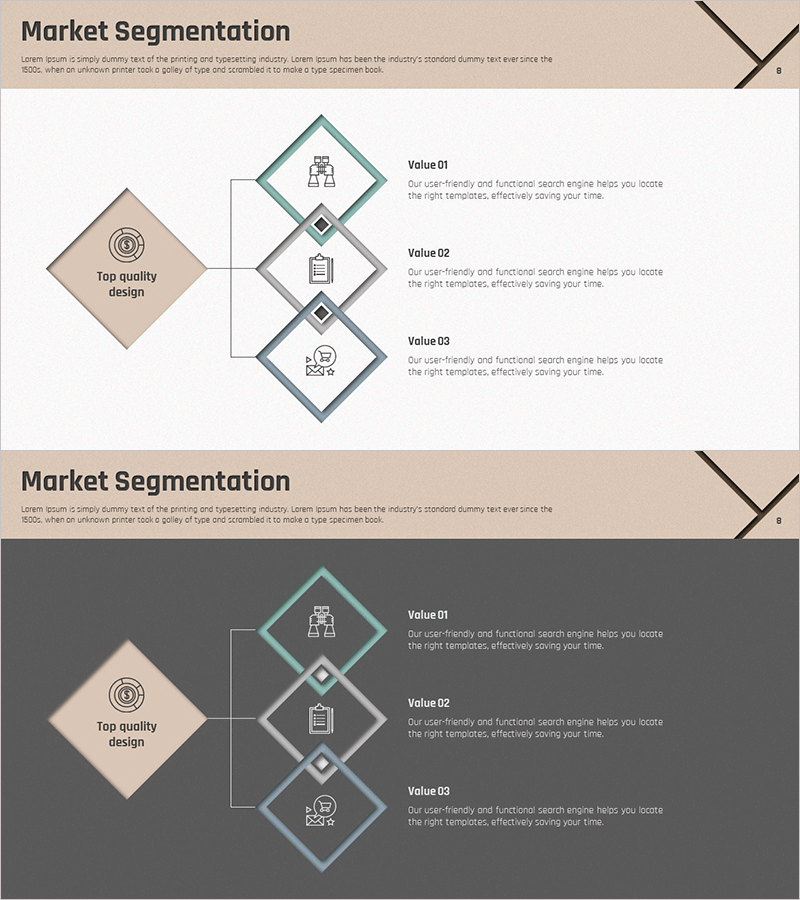
A square overlay diagram PowerPoint slide designed for market segmentation analysis and hierarchical relationship visualization. The template features a beige diamond shape on the left connected to three vertically stacked square nodes with teal borders, creating a clear layered structure. Each square node includes space for icons, titles, and descriptive text, making it ideal for presenting customer segments, value propositions, or strategic frameworks. The slide deck is fully editable and ready to use in business presentations, strategy reports, and analytical materials.
Usage Points
-
Main Usage
Visualize three-tier hierarchical structures such as market segmentation, customer classification, and value proposition analysis. The diamond-to-square node layout intuitively conveys parent-child relationships, with each node offering dedicated areas for icons, labels, and supporting text.
-
How to Use
Apply this diagram in business strategy presentations, marketing plans, organizational structure explanations, and product positioning analyses. Double-click each square node to edit text, adjust shape colors and sizes to emphasize priority levels, and customize the layout to match your presentation theme.
-
Recommended For
Executives, strategy teams, marketing professionals, consultants, and educators who need to explain complex market structures or organizational hierarchies. Particularly suited for customer analysis, business portfolio management, team role definition, and any scenario requiring three-level classification.
-
Slide Structure
Two-slide template with light background on slide 1 and dark background on slide 2, both featuring the same beige diamond (left) and three teal-bordered square nodes (right, vertical alignment). Each square node contains icon placeholder, title field, and description text area. Optimized for 16:9 widescreen format with PPTX compatibility.
Related Products
-

SWOT Overlay Diagram – Effective Use for Market Analysis and Strategy Development
#Market and Competitor Analysis #Diagram #SWOT Analysis
-

Components of the Green Business Program – Sustainable Growth
#Product/Service Introduction #Diagram #Features
-

Partnership Business Operation Plan Slide
#Product/Service Introduction #Business Management #Technical Approach
-

Beer Tree Structure Chart – A New Paradigm of Data Visualization
#Product/Service Introduction #Technical Approach #Diagram
