Sales Revenue Analysis Table Chart – Efficiency and Reliability
RM0400003_28
- Last Update 02/15/2025
- File Size 3.6MB
- # of Slides 2
- File Format PPTX
- Slide Ratio 16:9
- Color
Keywords
- #Content-Based Slides
- #Design-Based Slides
- #Operational Plan
- #Financial Plans and Performance
- #Diagram
- #Capital Investment Plan
- #Capital Requirements
- #Table
- #16:9
- #sales revenue analysis PowerPoint slide
- #financial table chart template
- #multi-column data comparison slide
- #sales performance table design
- #how to create a sales table in PowerPoint
About the Product
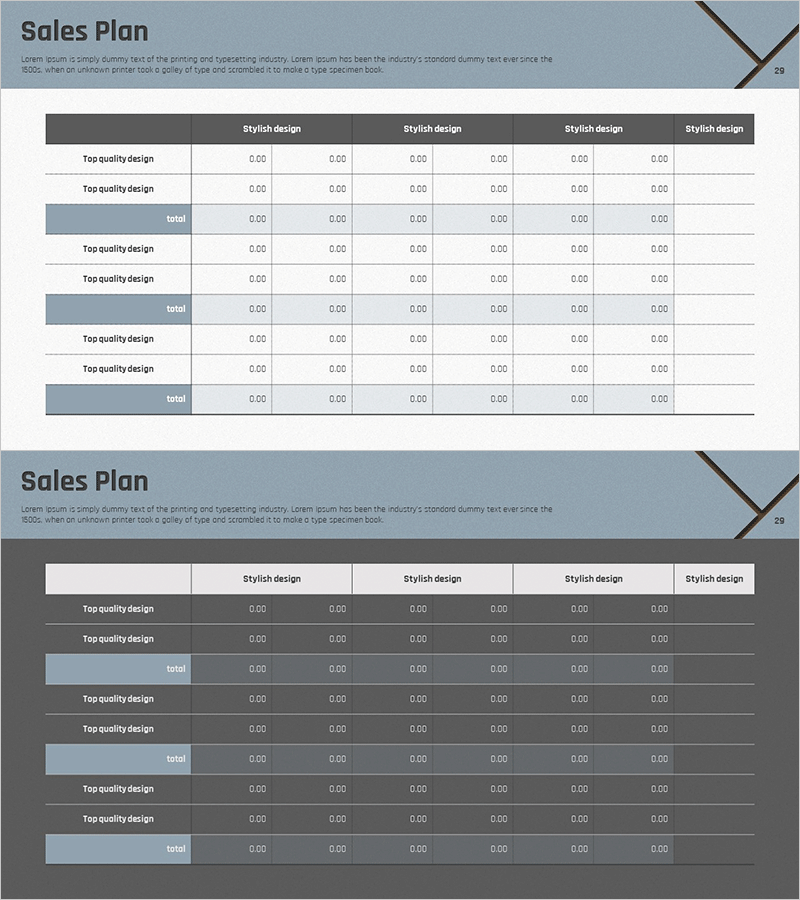
A 2-slide PowerPoint presentation designed for sales revenue analysis and financial data visualization. The layout features a dark gray header with light background contrast to enhance data readability, accommodating 6 columns for multi-item comparison. Each slide is divided into 3 sections with a title area at the top and 6 data entry rows total. The table structure includes subtotal rows for cumulative calculations, making it ideal for financial reports, business performance reviews, and operational planning presentations.
Usage Points
-
Main Usage
This slide enables comparison and analysis of multiple numerical data points—such as sales revenue, cost structure, and performance metrics—in table format. The gray header and light background provide strong visual contrast to enhance financial readability, while subtotal rows in each section allow for cumulative data display and summary calculations.
-
How to Use
Use in financial reports, quarterly performance presentations, and business planning sessions to input sales figures, budget vs. actual comparisons, and departmental performance metrics. Double-click any cell to edit text and numbers, add or remove rows as needed, and adjust column widths to fit your data.
-
Recommended For
CFOs, finance managers, business operations directors, and team leads presenting financial status to executives, investors, and boards. Particularly effective for quarterly performance reviews, budget execution analysis, and departmental profitability assessments.
-
Slide Structure
2-slide template with each slide containing 1 title area at the top and 3 table sections in the center. Each section comprises 2 data rows plus 1 subtotal row, providing 6 columns total (including Stylish design headers) for data entry and analysis.
Related Products
-

Promotional Product Sales Revenue Structure Table
#Operational Plan #Financial Plans and Performance #Diagram
-

Sales Revenue Comparison Analysis Table – Effective Operational Planning
#Operational Plan #Financial Plans and Performance #Diagram
-

Table of Operating Capital Securing Strategies – Financial Planning and Performance
#Operational Plan #Financial Plans and Performance #Diagram
-

Marketing Budget Allocation Chart – Visualizing Operations and Performance
#Operational Plan #Financial Plans and Performance #Diagram
