Sales Revenue Analysis Table – Operational Planning and Performance
RM0400004_28
- Last Update 02/15/2025
- File Size 2MB
- # of Slides 2
- File Format PPTX
- Slide Ratio 16:9
- Color
Keywords
- #Content-Based Slides
- #Design-Based Slides
- #Operational Plan
- #Financial Plans and Performance
- #Diagram
- #Capital Investment Plan
- #Capital Requirements
- #Table
- #16:9
- #sales revenue analysis PowerPoint slide
- #financial table template
- #operational planning performance slide
- #sales data comparison PPT
- #two-row financial table PowerPoint
About the Product
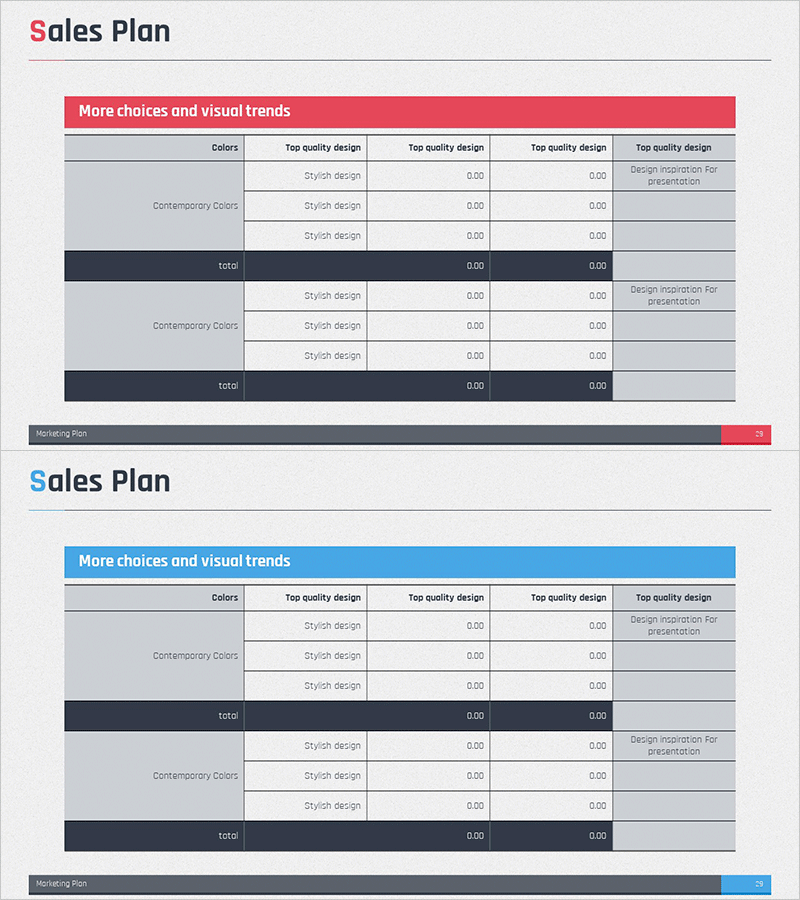
A PowerPoint slide designed to compare sales revenue analysis and operational planning performance side by side. Features a dual-tone header in pink and blue with a gray background table structure that effectively visualizes financial data and performance metrics. The 2-slide set provides color-variant layouts with consistent input areas for seamless presentation flow. Each slide maintains aligned data entry zones for colors, design styles, and numerical values. Ready to use immediately in financial reports, business performance presentations, and operational review meetings.
Usage Points
-
Main Usage
Displays sales revenue status and operational planning versus actual results simultaneously to communicate financial performance clearly. Color-coded headers visually separate two data layers, while aligned numerical input areas enhance financial readability and data comprehension.
-
How to Use
Use in financial report sales performance sections, quarterly or annual results presentations, and operational planning review meetings. Apply the pink header slide to emphasize positive results and the blue header for objective analysis tone. Edit table values and item names directly to input customized financial data.
-
Recommended For
Recommended for CFOs, finance managers, business operations managers, and executives preparing financial reports. Ideal for quarterly performance reviews, investor reporting, internal management meetings, and business planning stages where sales revenue status must be presented structurally.
-
Slide Structure
Each slide contains one title area, one color-coded header, and multi-row data input zones. Left 'Colors' column, center 'Design Style' column, and right numerical input area repeat across two rows. Bottom 'Marketing Plan' navigation bar guides document flow.
Related Products
-

Construction Permit and Construction Status Table – Operational Plan and Financial Performance
#Operational Plan #Financial Plans and Performance #Diagram
-

Sales Revenue Analysis Table Chart – Efficiency and Reliability
#Operational Plan #Financial Plans and Performance #Diagram
-

Sales Plan Table Chart – Efficient Operational Management
#Operational Plan #Financial Plans and Performance #Diagram
-

Sales & Investment Plan Slide Template
#Operational Plan #Financial Plans and Performance #Diagram
