Market Segmentation Analysis Table & Donut Chart for Market Insights
RM0400002_7
- Last Update 02/14/2025
- File Size 1MB
- # of Slides 2
- File Format PPTX
- Slide Ratio 16:9
- Color
Keywords
- #Content-Based Slides
- #Design-Based Slides
- #Market and Competitor Analysis
- #Diagram
- #Graph
- #Competitor Analysis
- #Market Analysis
- #Table
- #Circles
- #Doughnut Chart
- #16:9
- #donut chart PowerPoint
- #pie chart slide template
- #market segmentation analysis
- #data visualization presentation
- #market share chart download
About the Product
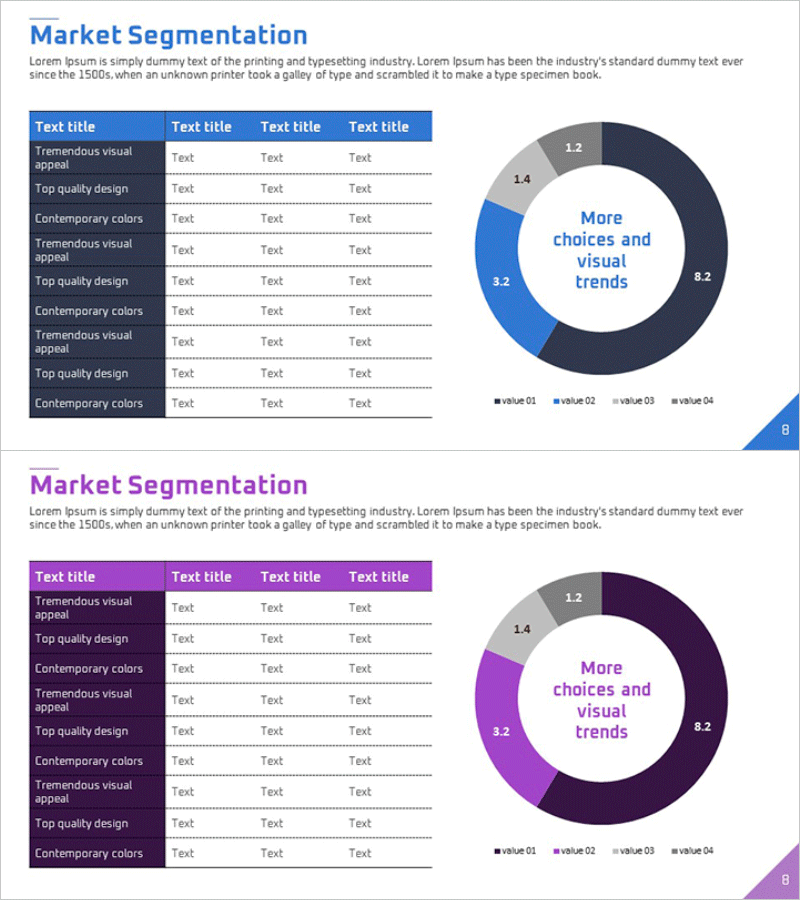
A 2-slide PowerPoint presentation template for market segmentation analysis featuring a data table and donut chart visualization. The first slide displays a 9-row by 4-column table organizing market segmentation criteria, while the second slide presents a 4-series donut chart showing market share distribution. Designed in blue and purple dual-tone color scheme, this slide deck is ready for immediate use in business presentations. Ideal for executive reports, marketing strategy presentations, competitive analysis, and data-driven decision-making scenarios.
Usage Points
-
Main Usage
Simultaneously present market segmentation data through both structured table format and visual donut chart representation. Effectively communicate 4-series ratio data such as market share percentages, customer composition, and product category distribution to stakeholders.
-
How to Use
Insert into executive reports, marketing strategy presentations, and business plan market analysis sections. Replace sample data in the table with actual figures; the donut chart updates automatically. Customize colors and legend labels to match corporate branding guidelines.
-
Recommended For
Marketing managers, business strategists, executives, management consultants, and investor relations professionals preparing market analysis materials. Particularly effective when presenting multiple segmentation dimensions (geographic, demographic, product-based) simultaneously.
-
Slide Structure
Slide 1: 9-row × 4-column data table with header row for market segmentation categories / Slide 2: 4-series donut chart with center text area plus 4-item legend. 16:9 widescreen format, fully editable PPTX with all elements customizable.
Related Products
-

Market Analysis Slide Using Donut Charts and Table
#Market and Competitor Analysis #Diagram #Graph
-

Competitor Revenue Analysis Chart – Visualize Market Dynamics
#Market and Competitor Analysis #Diagram #Graph
-

Visualizing Competitive Analysis with Table and 3 Donut Graphs
#Market and Competitor Analysis #Diagram #Graph
-

Contribution-Based Performance Chart – Infographic for Market Analysis
#Market and Competitor Analysis #Graph #Competitor Analysis
