Funding Plan Chart – Financial Performance Analysis
RM0400002_27
- Last Update 02/14/2025
- File Size 1MB
- # of Slides 2
- File Format PPTX
- Slide Ratio 16:9
- Color
Keywords
About the Product
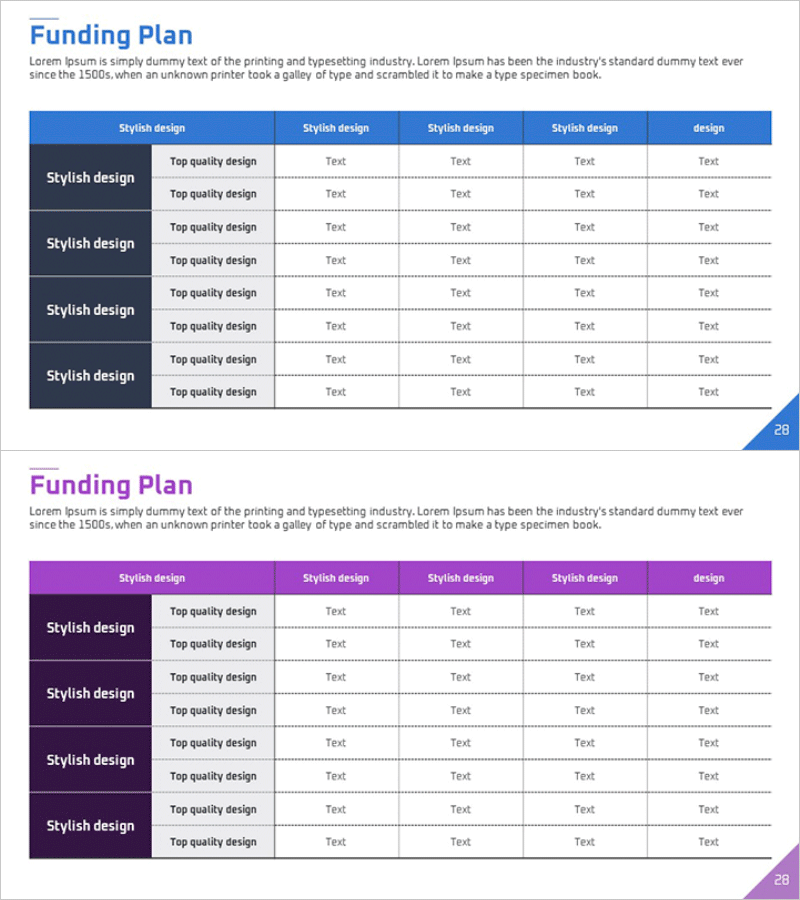
An essential slide for investment pitches and financial reports, this funding plan slide presents capital allocation and financial metrics in a clear, row-based table format. Two color versions—blue and purple—are included, each featuring a structured layout with category labels on the left and corresponding data fields on the right. The hierarchical table design makes it easy to compare multiple financial items and communicate investment requirements at a glance. The PowerPoint slide is fully editable, allowing you to input actual funding amounts, investment categories, and projected returns. Ideal for business plans, investor presentations, financial analysis reports, and capital allocation discussions.
Usage Points
-
Main Usage
Communicate funding requirements, investment allocation, and financial projections in investor presentations, business plans, and financial reports. The row-based table structure enables side-by-side comparison of multiple financial items and supports data-driven decision-making.
-
How to Use
Enter funding categories (e.g., capital requirements, ROI, operating costs) in the left column and corresponding figures in the right data fields. Select the color version that matches your corporate branding or presentation theme. Duplicate table rows to add more financial items as needed.
-
Recommended For
CFOs, financial managers, and investor relations professionals presenting financial performance and capital needs. Suitable for startup pitch decks, corporate financial disclosures, business plan presentations, and investment committee reports.
-
Slide Structure
Two-slide set featuring blue and purple versions. Each slide includes a title section, descriptive text area, and a 5–7 row financial data table. Table headers are color-coded by version, with each row containing a category label and editable data cell for financial figures.
Related Products
-

Project Funding Plan – Easy to Create Financial Planning Slide
#Financial Plans and Performance #Diagram #Capital Requirements
-

Investment and Fund Management Plan Slide – Financial Insights
#Financial Plans and Performance #Diagram #Capital Requirements
-

Highlight Table Chart – Clear Visualization of Financial Performance
#Financial Plans and Performance #Diagram #Capital Requirements
-

Sleek Diagram for a Trial Table
#Financial Plans and Performance #Diagram #Capital Requirements
