Funding Plan Table – Visualizing Financial Performance
RM0400015_27
- Last Update 02/19/2025
- File Size 0.4MB
- # of Slides 2
- File Format PPTX
- Slide Ratio 16:9
- Color
Keywords
- #Content-Based Slides
- #Design-Based Slides
- #Financial Plans and Performance
- #Diagram
- #Capital Requirements
- #Key Financial Indicators
- #Table
- #16:9
- #funding plan table PowerPoint
- #financial data table slide
- #investment plan presentation
- #multi-year financial visualization
- #how to create a funding plan in PowerPoint
About the Product
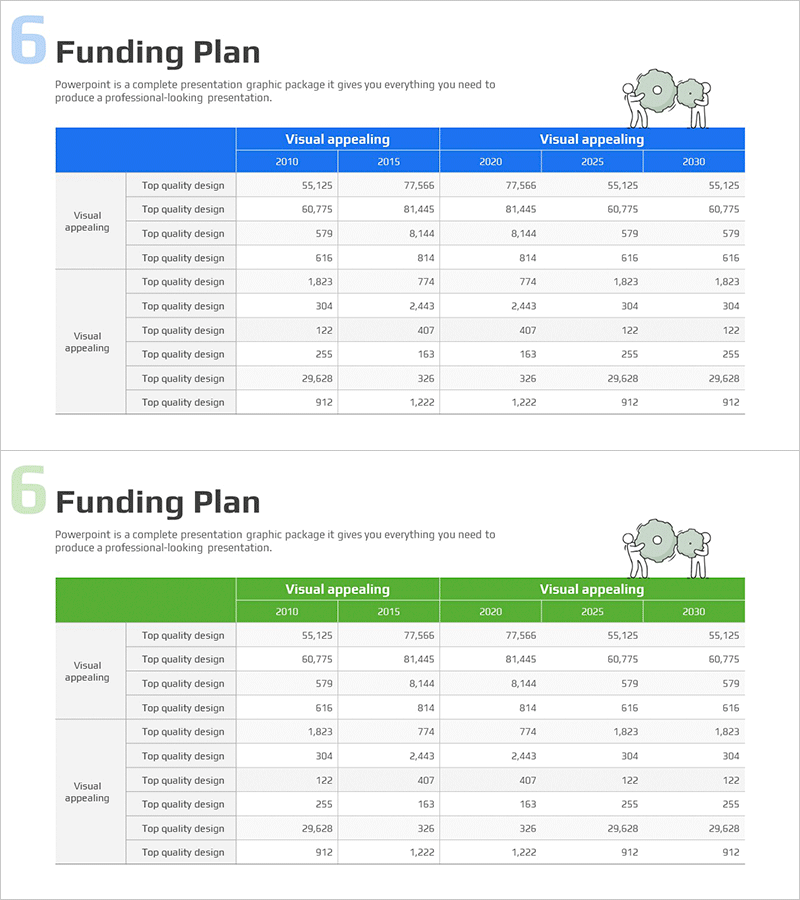
An essential funding plan table PowerPoint slide for investment pitches and financial reports. Provided in two color versions—blue and green—to clearly visualize year-over-year financial performance metrics from 2010 to 2030. Each row features consistent 'Top quality design' labeling to maintain information hierarchy and maximize numerical readability. Designed in 16:9 widescreen PPTX format for seamless compatibility across all presentation environments. Instantly applicable to financial analysis, investor relations materials, business plans, and corporate presentations.
Usage Points
-
Main Usage
Communicate multi-year funding allocation and financial performance metrics in investor relations, financial reports, and business plans. Two color options—blue and green—allow alignment with corporate branding, while the tabular format enables decision-makers to quickly grasp numerical data and trends.
-
How to Use
Input actual funding amounts, return on investment figures, and financial metrics into the provided table structure. Maintain the year-by-year columns and item-by-item rows while updating data. Select your preferred color version to match presentation tone, and add or remove rows and columns as needed to accommodate additional data points.
-
Recommended For
CFOs, financial managers, investment officers, and executives. Ideal for startup investment pitches, corporate quarterly and annual financial reports, consulting firm financial analyses, and financial institution fund management presentations.
-
Slide Structure
Two-slide set, each containing a title area, descriptive text section, and a multi-row, multi-column data table. The table features a header row with years (2010, 2015, 2020, 2025, 2030) and 10+ data rows with editable cells for numerical input and comparison.
Related Products
-

Marketing Income Statement Table – Financial Performance Analysis
#Financial Plans and Performance #Diagram #Capital Requirements
-

Funding Plan Table for Financial Planning Slide
#Financial Plans and Performance #Diagram #Capital Requirements
-

Diagram for Visualizing Financial Plans – Grey Brown Design
#Financial Plans and Performance #Diagram #Capital Requirements
-

Investment and Fund Management Plan Slide – Financial Insights
#Financial Plans and Performance #Diagram #Capital Requirements
