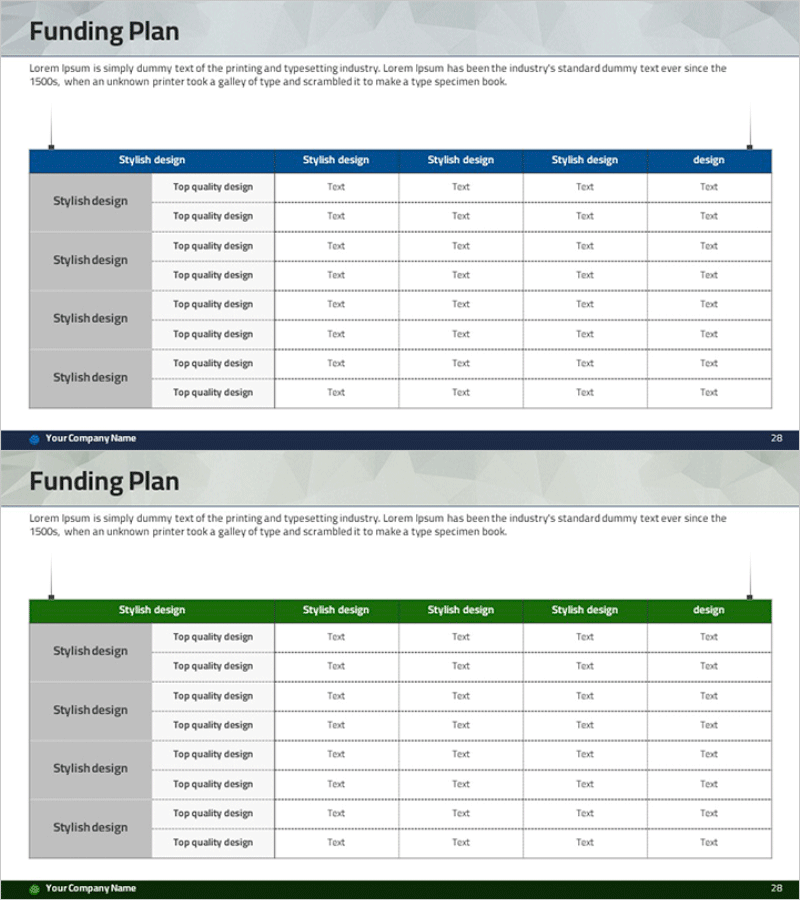
Funding Plan Table – Visualizing Financial Performance
RM0400005_27
- Last Update 02/15/2025
- File Size 2.9MB
- # of Slides 2
- File Format PPTX
- Slide Ratio 16:9
- Color
Keywords
- #Content-Based Slides
- #Design-Based Slides
- #Financial Plans and Performance
- #Diagram
- #Capital Requirements
- #Key Financial Indicators
- #Table
- #16:9
- #funding plan table PowerPoint slide
- #financial data table presentation
- #investment budget PPT
- #how to create a funding plan in PowerPoint
- #financial metrics slide template
About the Product
A table-based PowerPoint slide that clearly visualizes investment funding plans and financial performance metrics. Featuring a dark blue header and gray row divisions for enhanced data readability, this 2-slide set effectively communicates funding requirements, return on investment, budgets, and financial indicators. Available in 16:9 widescreen PPTX format for immediate editing and use in business plans, investor pitch decks, and financial reports. The structured table format builds credibility in financial presentations and supports stakeholder decision-making with transparent data visualization.
Usage Points
-
Main Usage
Organize investment funding amounts, return on investment, budget allocation, and other financial metrics in table format to strengthen financial credibility in investor pitch decks and business plans. The dark blue header and gray row divisions create clear data hierarchy, enabling audiences to quickly identify key financial figures and performance indicators.
-
How to Use
Input financial data into the table cells, including funding requirements, ROI, balance sheet items, income statement data, and cash flow figures. Add category labels in the header row (e.g., Funding Amount, ROI, Payback Period) and corresponding numerical values with units in data rows to present financial status at a glance.
-
Recommended For
CFOs, financial managers, and investor relations professionals use this slide in business plans, investor pitch decks, financial reports, and quarterly performance presentations. Particularly effective for presentations to investors, financial institutions, and executive teams where financial transparency and credibility are critical.
-
Slide Structure
2-slide set with dark blue header (5 columns) and gray data rows (6-8 rows per slide). Left side includes a gray area for slide title input, while the right side contains the data table for financial items and figures. 16:9 widescreen format optimized for projector displays and online presentations.
Related Products
-

Funding Plan Table for Financial Planning Slide
#Financial Plans and Performance #Diagram #Capital Requirements
-

Project Funding Plan – Easy to Create Financial Planning Slide
#Financial Plans and Performance #Diagram #Capital Requirements
-

Highlight Table Chart – Clear Visualization of Financial Performance
#Financial Plans and Performance #Diagram #Capital Requirements
-

Diagram for Visualizing Financial Plans – Grey Brown Design
#Financial Plans and Performance #Diagram #Capital Requirements
