Table of Funding Plans by Year
RM0400001_27
- Last Update 02/14/2025
- File Size 0.4MB
- # of Slides 2
- File Format PPTX
- Slide Ratio 16:9
- Color
Keywords
- #Content-Based Slides
- #Design-Based Slides
- #Financial Plans and Performance
- #Diagram
- #Capital Requirements
- #Key Financial Indicators
- #Table
- #16:9
- #funding plan PowerPoint table
- #financial data slide template
- #annual funding comparison PPT
- #budget allocation table
- #financial analysis presentation slide
About the Product
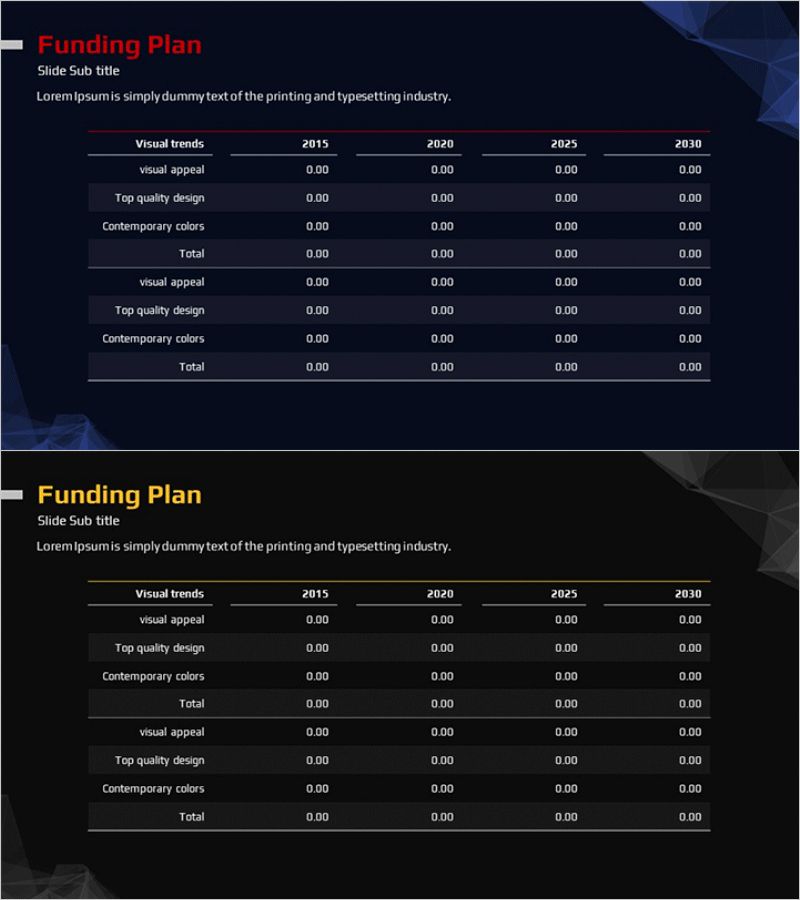
A professional PowerPoint slide designed to visualize annual funding plans with clear data comparison across multiple years. This template presents funding allocation data from 2015 to 2030 in a structured table format, enabling side-by-side analysis of financial metrics. The slide features eight data rows (visual appeal, top quality design, contemporary colors, and totals—each repeated twice) across four year columns, optimizing readability for financial presentations. Dark background with white text and accent colors (red and yellow) creates strong visual contrast suitable for investor pitches, IR materials, and financial reports. The 2-slide set allows presentation of multiple funding scenarios or baseline versus alternative projections.
Usage Points
-
Main Usage
Present annual funding plans and financial projections to investors, financial institutions, and stakeholders. This slide enables clear visualization of multi-year funding allocation, helping audiences understand capital requirements and financial strategy at a glance.
-
How to Use
Insert this slide into business plans, investor pitch decks, or financial reports in the funding or financial overview section. Simply enter your numerical data into the table cells; formatting automatically applies. Customize colors and fonts to match your corporate branding. Use both slides to compare baseline and alternative funding scenarios.
-
Recommended For
CFOs, financial managers, investor relations (IR) professionals, and business development teams presenting funding strategies. Particularly valuable for startup fundraising pitches, corporate medium-term financial planning presentations, and bank loan application materials.
-
Slide Structure
Each slide contains a title (Funding Plan), subtitle, and descriptive text area, with the main table structured as 8 rows (visual appeal, top quality design, contemporary colors, and totals—each set twice) by 4 columns (2015, 2020, 2025, 2030). Dark background with white table lines and accent colors ensures optimal data readability and professional appearance.
Related Products
-

Diagram for Visualizing Financial Plans – Grey Brown Design
#Financial Plans and Performance #Diagram #Capital Requirements
-

Curved Theme Purple Template Diagram – Key to Financial Planning
#Financial Plans and Performance #Diagram #Capital Requirements
-

Blue Green Table Analysis – Visualizing Financial Plans
#Financial Plans and Performance #Diagram #Capital Requirements
-

Ringer Shape Subdivided Column Graph – Funding Plan and Performance
#Financial Plans and Performance #Diagram #Capital Requirements
