Investment and Fund Management Plan Slide – Financial Insights
RM0400008_27
- Last Update 02/16/2025
- File Size 0.3MB
- # of Slides 2
- File Format PPTX
- Slide Ratio 16:9
- Color
Keywords
About the Product
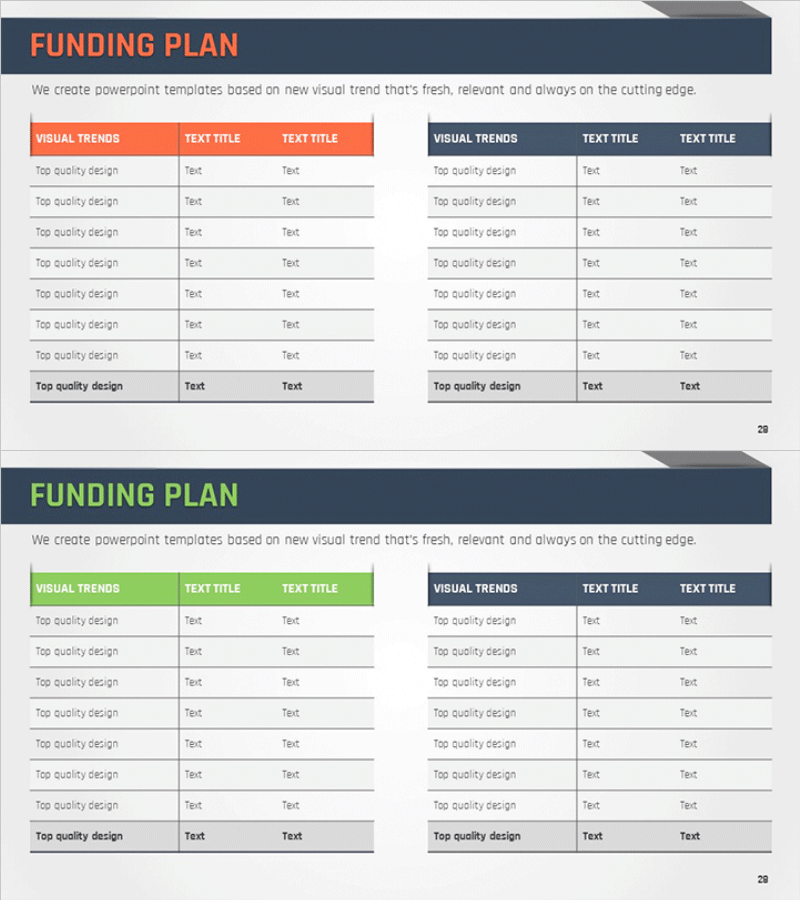
A 2-slide PowerPoint presentation for visualizing investment and fund management plans. Features a dual-tone header design with orange and navy blue, creating a side-by-side comparison table layout ideal for presenting financial data and operational strategies simultaneously. Each slide provides three columns of input areas with category headers and detailed content rows below. The layout is specifically designed for business plans and investor presentations where fund allocation methods, return on investment, and financial metrics need clear visual communication. Delivered in 16:9 widescreen PPTX format, fully editable and ready to customize.
Usage Points
-
Main Usage
Present investment funding sources, operational plans, and financial metrics using a clear side-by-side comparison structure. The orange and navy headers enable comparison of two scenarios, time periods, or strategic approaches to support executive decision-making.
-
How to Use
Enter category names in each table header (e.g., Funding Sources, Operational Strategy), then input specific figures and descriptions in the rows below. Organize financial information such as ROI, fund allocation, and implementation timelines in tabular format for presentation.
-
Recommended For
CFOs, finance managers, and business development teams presenting fund management plans to investors, shareholders, and executives. Ideal for business plan documents, investor relations materials, and financial reports requiring fund allocation sections.
-
Slide Structure
2-slide deck. Each slide contains a title area at top, left orange-header table (3 columns), and right navy-header table (3 columns). Six total input areas enable parallel presentation of funding sources, operational methods, projected returns, and related financial metrics.
Related Products
-

Project Funding Plan – Easy to Create Financial Planning Slide
#Financial Plans and Performance #Diagram #Capital Requirements
-

Marketing Income Statement Table – Financial Performance Analysis
#Financial Plans and Performance #Diagram #Capital Requirements
-

Diagram for Visualizing Financial Plans – Grey Brown Design
#Financial Plans and Performance #Diagram #Capital Requirements
-

Funding Plan Table for Financial Planning Slide
#Financial Plans and Performance #Diagram #Capital Requirements
