Performance Analysis Mixed Graphs & Tables – Efficient Data Visualization
RM0300024_17
- Last Update 02/13/2025
- File Size 1.1MB
- # of Slides 2
- File Format PPTX
- Slide Ratio 16:9
- Color
Keywords
- #Content-Based Slides
- #Design-Based Slides
- #Company Introduction
- #Market and Competitor Analysis
- #Diagram
- #Graph
- #Other
- #Key Achievements
- #Market Analysis
- #Table
- #16:9
- #performance analysis PowerPoint slide
- #mixed graph chart template
- #data table slide design
- #sales metrics visualization PPT
- #business performance dashboard slide
About the Product
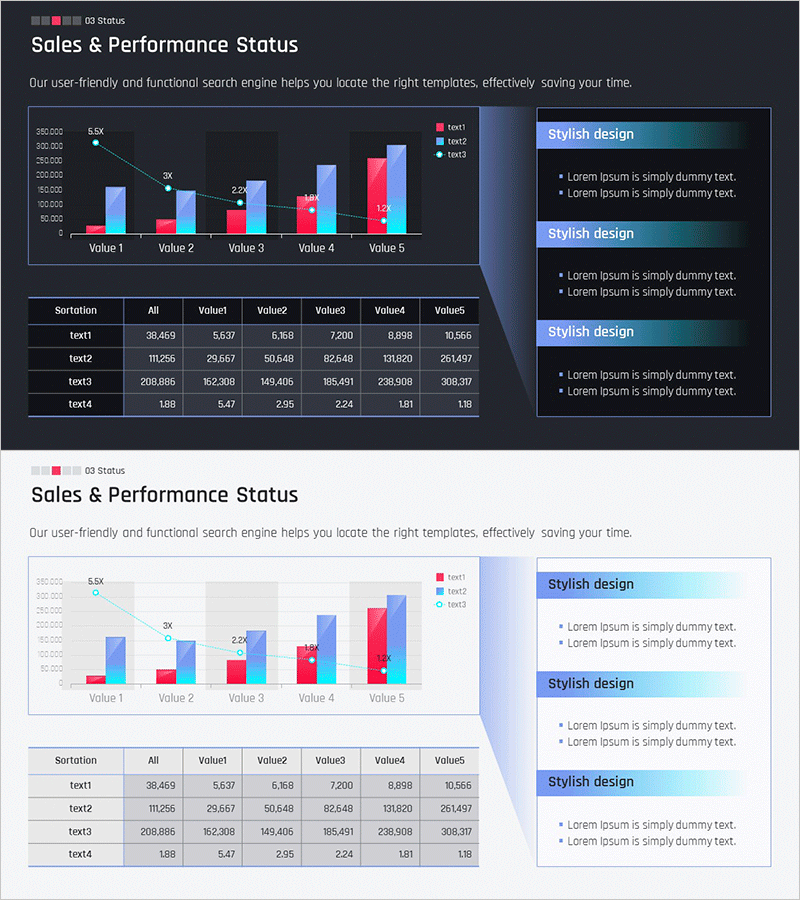
A professional PowerPoint slide set for visualizing sales performance and business metrics using combined bar and line charts with data tables. The dark background design features red, blue, and cyan colored bars alongside trend lines, enabling multi-metric comparison at a glance. The right side includes three text boxes for highlighting key insights and analysis results. The bottom section contains a structured data table with 4 rows and 6 columns for detailed numerical information. This 16:9 widescreen 2-slide set is ready to edit and customize for immediate use in presentations.
Usage Points
-
Main Usage
Display quarterly or monthly sales results, departmental performance indicators, and market share trends by combining multiple data series. The dual-axis approach with bars and lines simultaneously shows absolute values and trends, providing clear evidence for executive decision-making.
-
How to Use
Use in quarterly business reviews, management reports, and investor presentations within the performance analysis section. Input actual data into the left-side graphs, write key insights in the right-side text boxes, and populate the bottom table with detailed figures to complete the slide.
-
Recommended For
Finance teams, sales departments, and business planning units presenting quarterly or semi-annual results. Ideal for executive briefings, investor relations meetings, shareholder updates, and consulting firm client analysis reports.
-
Slide Structure
Slide 1: Title area + mixed graph (3 bar series + 1 line series) + 3 text boxes on right. Slide 2: Title area + mixed graph (alternative dataset) + 3 text boxes on right. Both slides include 4-row by 6-column data table at bottom for detailed metrics.
Related Products
-

Key Business Performance Analysis Chart – A Measure of Trust
#Company Introduction #Market and Competitor Analysis #Diagram
-

Positioning Market Analysis Chart – Understanding Markets and Strategies
#Market and Competitor Analysis #Marketing Plan and Strategy #Diagram
-

Market Distribution Analysis Positioning Map – Strengthening Competitiveness
#Market and Competitor Analysis #Marketing Plan and Strategy #Diagram
-

Clothing Market Positioning Map – Strategic Analysis
#Market and Competitor Analysis #Marketing Plan and Strategy #Diagram
