Positioning Market Analysis Chart – Understanding Markets and Strategies
RM0100005_25
- Last Update 01/26/2025
- File Size 0.3MB
- # of Slides 2
- File Format PPTX
- Slide Ratio 16:9
- Color
Keywords
- #Content-Based Slides
- #Design-Based Slides
- #Market and Competitor Analysis
- #Marketing Plan and Strategy
- #Diagram
- #Graph
- #Other
- #Market Analysis
- #Positioning
- #Table
- #16:9
- #positioning PPT slide
- #market analysis PowerPoint chart
- #two-quadrant comparison slide
- #marketing positioning template
- #bubble chart PowerPoint
About the Product
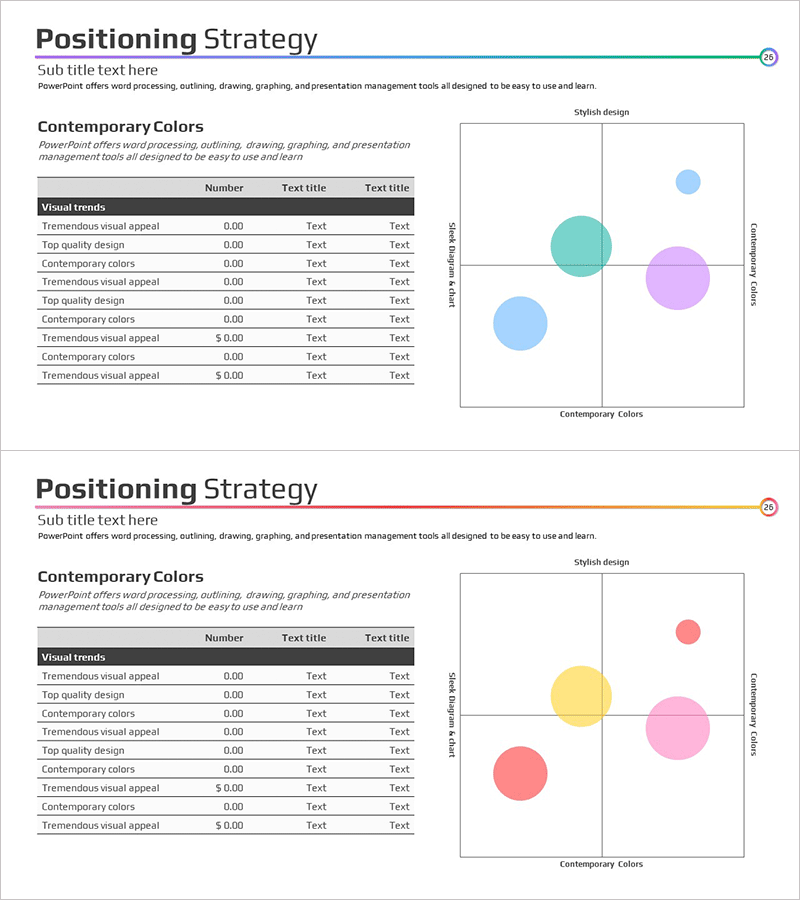
A 2-slide PowerPoint presentation template visualizing positioning strategy through bubble charts. The first slide features blue, turquoise, and pink circular bubbles representing market positioning, while the second slide uses pink, yellow, and lavender bubbles for competitive analysis. Each slide includes title, subtitle, and data visualization sections, enabling clear communication of market understanding and positioning rationale in marketing strategy presentations. Delivered in 16:9 widescreen PPTX format, fully editable and ready to customize with your data.
Usage Points
-
Main Usage
Communicate market positioning and competitive analysis in marketing strategy presentations using bubble chart visualization. Effectively present data-driven insights during target market definition, competitor comparison, and differentiation strategy development phases.
-
How to Use
Insert into the market analysis section of marketing plans, business proposals, or investor pitch decks. Edit bubble sizes and positions to reflect actual market data, and customize axis labels and legends to match your presentation context.
-
Recommended For
Marketing managers, business planning teams, executives preparing reports, startup founders pitching to investors, consulting firms presenting market analysis, and product teams developing positioning strategies.
-
Slide Structure
Slide 1: Title and subtitle area with three-color bubble chart (blue, turquoise, pink) featuring X and Y axis labels. Slide 2: Title and subtitle area with three-color bubble chart (pink, yellow, lavender) with axis labels. Each slide contains three text input areas and one data visualization section.
Related Products
-

Positioning Point Area Graph – Strategy for Market Analysis
#Market and Competitor Analysis #Marketing Plan and Strategy #Diagram
-

Business Market Positioning Strategy Slide – Competitive Analysis
#Market and Competitor Analysis #Marketing Plan and Strategy #Diagram
-

Artificial Intelligence Development Market Positioning Map – Effective Visual Data Comparison
#Market and Competitor Analysis #Marketing Plan and Strategy #Diagram
-

Competitor Positioning Graph – Diagram for Market Analysis
#Market and Competitor Analysis #Marketing Plan and Strategy #Diagram
