Key Performance Analysis Table – Achievements at a Glance
RM0200007_6
- Last Update 02/03/2025
- File Size 1.2MB
- # of Slides 2
- File Format PPTX
- Slide Ratio 16:9
- Color
Keywords
- #Content-Based Slides
- #Design-Based Slides
- #Company Introduction
- #Market and Competitor Analysis
- #Diagram
- #Graph
- #Other
- #Key Achievements
- #Competitive Advantage
- #Table
- #16:9
- #key performance analysis table PowerPoint
- #business performance data slides
- #bar chart table design
- #performance metrics presentation
- #how to create performance analysis in PowerPoint
About the Product
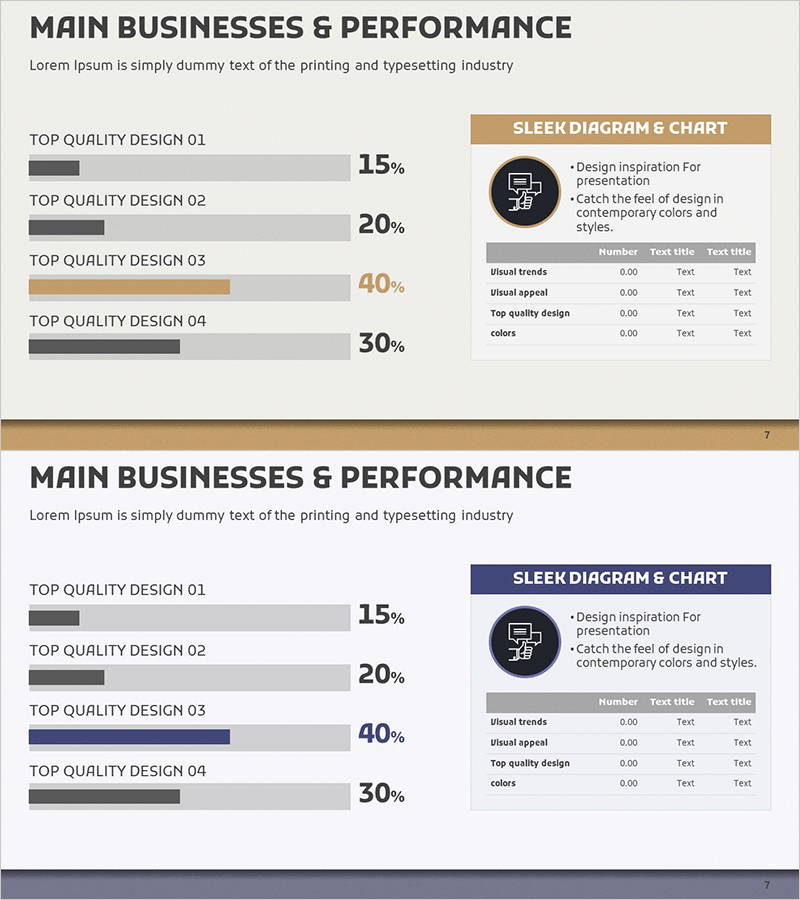
A 2-slide PowerPoint presentation designed to showcase key business performance metrics with visual clarity. The layout combines a horizontal bar chart on the left side with an information box on the right, enabling you to display performance data alongside detailed insights. The color scheme features beige, gray, and navy tones, creating a professional and trustworthy atmosphere suitable for corporate presentations. With ample text input areas, you can immediately integrate your actual data. Optimized for 16:9 widescreen format in PPTX, this slide deck works seamlessly in business plans, investor pitch decks, and performance reports.
Usage Points
-
Main Usage
This slide effectively communicates core business performance indicators through quantitative data and visual representation. The left-side horizontal bar chart compares four performance metrics as percentages, while the right-side information box accommodates supplementary analysis and strategic insights. It builds credibility with investors, employees, and business partners by presenting performance achievements in a structured, data-driven format.
-
How to Use
Replace the four chart item labels and percentage values with your actual performance data. Update the information box title and text fields with performance analysis, key insights, and future strategies. Colors can be customized to match your corporate brand guidelines, and the balance between chart and text areas is fully adjustable to suit your content needs.
-
Recommended For
Ideal for business plans, investor pitch decks, quarterly and annual performance reports, executive briefings, shareholder meeting presentations, and partner collaboration proposals. Particularly effective for finance and management sections where quantitative achievements and decision-making evidence are critical.
-
Slide Structure
The 2-slide set features a consistent layout with title area (top), left-side horizontal bar chart (4 items with percentage values), and right-side information box (icon, title, descriptive text, and data table). Optimized for 16:9 widescreen displays, all text and numerical elements are fully editable text boxes for seamless customization.
Related Products
-

Key Performance Analysis Graph – The Power of Data Visualization
#Company Introduction #Market and Competitor Analysis #Diagram
-

Performance Analysis Mixed Graphs & Tables – Efficient Data Visualization
#Company Introduction #Market and Competitor Analysis #Diagram
-

Analysis of Climbing Types Slide
#Company Introduction #Market and Competitor Analysis #Diagram
-

Industry Trends and Market Analysis Charts - Bar and Column Graphs
#Company Introduction #Market and Competitor Analysis #Diagram
