Table and Area Graph for Market Analysis
RJ0400015_13
- Last Update 05/21/2025
- File Size 1.3MB
- # of Slides 2
- File Format PPTX
- Slide Ratio 16:9
- Color
Keywords
- #Content-Based Slides
- #Design-Based Slides
- #Market and Competitor Analysis
- #Diagram
- #Graph
- #Other
- #Market Analysis
- #Table
- #Standard Table
- #16:9
- #table and area chart PowerPoint
- #data comparison slide template
- #market analysis presentation
- #trend visualization PowerPoint
- #competitive analysis slide
- #graph PowerPoint template download
About the Product
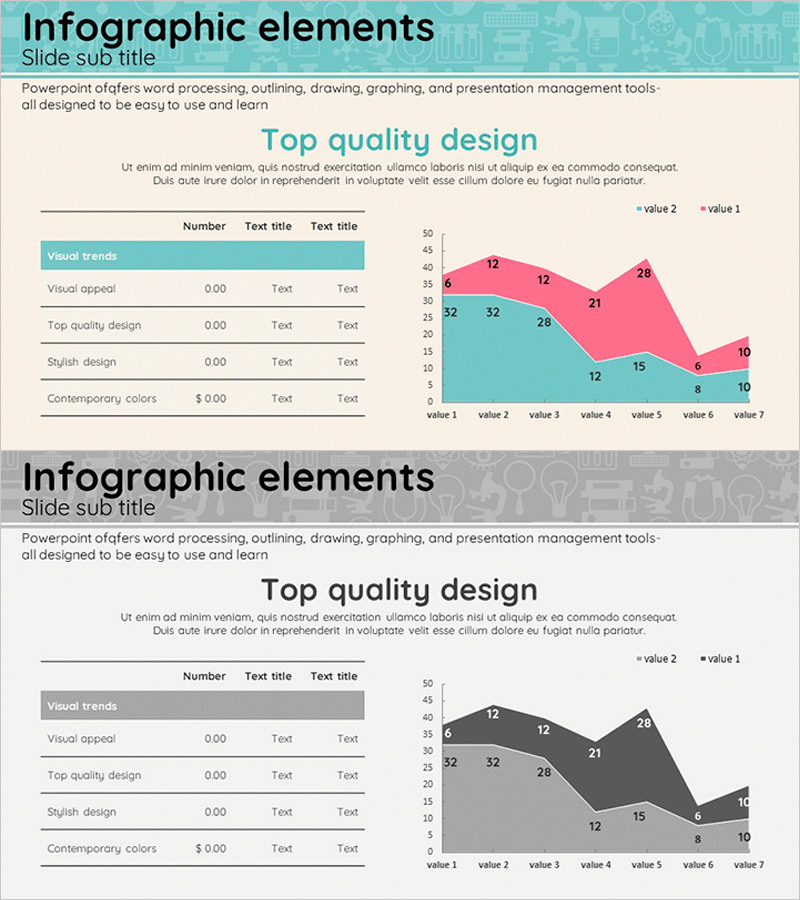
A comprehensive PowerPoint slide set combining a data table and area chart for market analysis and competitive comparison. The first slide presents a structured table with five metrics and three data columns, enabling quick numerical comparison for business presentations. The second slide features a seven-point area chart with turquoise and pink gradient layers, visually representing data trends and category relationships over time. Delivered in 16:9 widescreen PPTX format with fully editable text and numerical fields, allowing seamless customization for various presentation contexts including quarterly reports, market assessments, and strategic planning.
Usage Points
-
Main Usage
Designed for presentations requiring dual data visualization—precise numerical comparison via table format and temporal trend analysis through area charting. Ideal for market analysis, competitive benchmarking, revenue forecasting, and performance reporting where stakeholders need both detailed metrics and visual trend recognition.
-
How to Use
Input actual data into the first slide's table structure, then populate the area chart on slide two with corresponding trend values. Maintain or customize the turquoise and pink color scheme to match corporate branding. Edit axis labels, legend text, and metric titles to align with your presentation narrative and audience context.
-
Recommended For
Executive dashboards, business plans, marketing strategies, investor pitch decks, quarterly performance reviews, and financial reports. Recommended for executives, business analysts, marketing managers, financial planners, and strategy consultants presenting quantitative insights.
-
Slide Structure
Slide 1: Five-row table (Visual trends, Visual appeal, Top quality design, Stylish design, Contemporary colors) with three data columns (Number, Text title, Text title). Slide 2: Seven-point area chart with two data series displayed as overlapping turquoise and pink gradient areas, clearly delineating data layers and value ranges from 0 to 50.
Related Products
-

Business Market Positioning Strategy Slide – Competitive Analysis
#Market and Competitor Analysis #Marketing Plan and Strategy #Diagram
-

Status Analysis Donut Link Chart – Market and Competitor Analysis
#Company Introduction #Market and Competitor Analysis #Diagram
-

Gradient Theme Area Diagram – Market and Competitor Analysis
#Market and Competitor Analysis #Diagram #Graph
-

Industrial Data Report for Market Analysis Slides
#Market and Competitor Analysis #Diagram #Graph
