Shareholder Status Survey Donut Graph – Optimized for Market Analysis
RM0300006_7
- Last Update 02/08/2025
- File Size 1.5MB
- # of Slides 2
- File Format PPTX
- Slide Ratio 16:9
- Color
Keywords
- #Content-Based Slides
- #Design-Based Slides
- #Company Introduction
- #Market and Competitor Analysis
- #Diagram
- #Graph
- #Shareholder Structure
- #Market Analysis
- #Table
- #Circles
- #Standard Table
- #Doughnut Chart
- #16:9
- #donut chart PowerPoint
- #pie chart alternative slide
- #ratio visualization template
- #shareholder analysis PPT
- #market analysis donut graph
- #4-segment chart slide template
About the Product
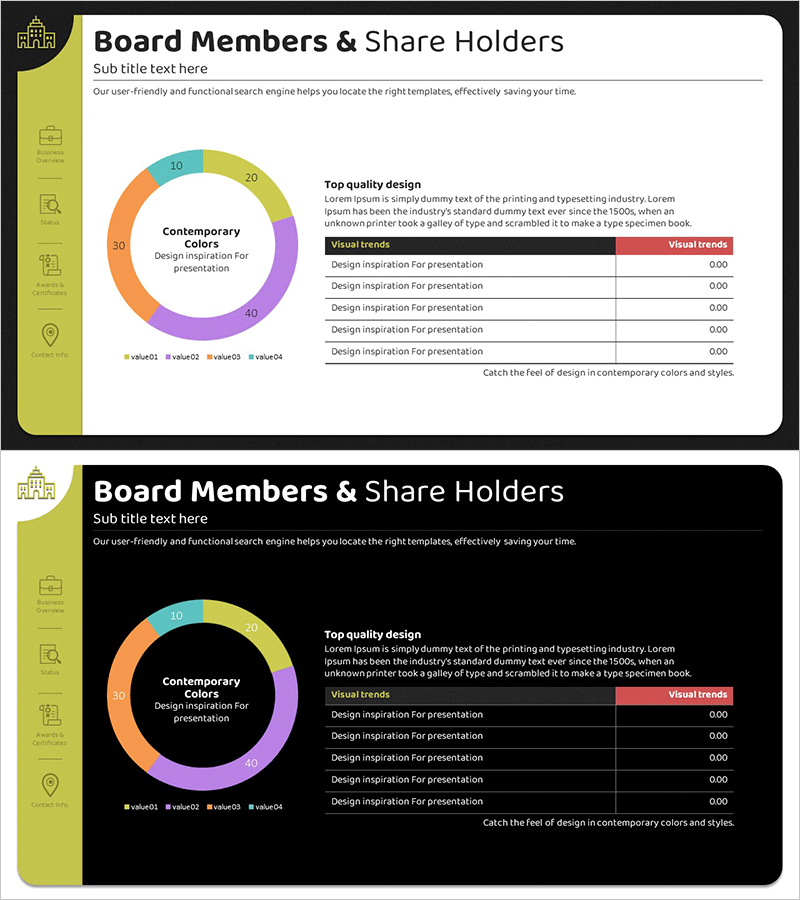
A 4-segment donut chart PowerPoint slide optimized for shareholder status surveys and market analysis presentations. The design features a clear color palette of blue, orange, yellow, and purple segments that intuitively represent proportional data, with a central space ideal for highlighting key metrics or titles. Comprising 2 slides in 16:9 widescreen format, this template accommodates various data scenarios and integrates seamlessly into modern business presentations. Effectively communicate composition ratios in investor reports, shareholder meetings, market share analysis, and strategic planning sessions with this versatile chart design.
Usage Points
-
Main Usage
The donut chart visualizes overall composition ratios while emphasizing key information in the central area. It simultaneously displays the proportional relationships of 4 items such as shareholder equity distribution, market share, customer segmentation, or asset allocation, with the center space reserved for aggregate figures, averages, or core messages that clarify information hierarchy.
-
How to Use
Apply this template to shareholder composition sections in investor reports, revenue breakdown analysis in quarterly earnings presentations, customer demographic distribution in market research reports, and resource allocation status in strategic planning meetings. Simply click each colored segment to input values and populate the central text box with totals or key performance indicators for immediate presentation use.
-
Recommended For
CFOs and finance professionals preparing shareholder meeting materials, marketing teams reporting market analysis findings to executives, consultants presenting customer segmentation strategies, and business development teams explaining portfolio composition. Ideal for all business presentations requiring intuitive communication of quantitative data.
-
Slide Structure
2-slide set featuring the primary 4-segment donut chart layout with blue, orange, yellow, and purple segments on the first slide, and an alternative design or data entry template on the second. Each slide includes a central input area for titles, numerical values, and legends, with 16:9 widescreen format allowing flexible text placement utilizing left-side margins.
Related Products
-

Status Analysis Donut Chart – Shareholder Status Analysis
#Company Introduction #Market and Competitor Analysis #Diagram
-

Status Analysis Donut Chart – Visualizing Market and Shareholder Status
#Company Introduction #Market and Competitor Analysis #Diagram
-

Shareholder Status Distribution Analysis Chart – Visualizing Shareholder Information
#Company Introduction #Market and Competitor Analysis #Diagram
-

Shareholder Status Analysis with Pie Charts and Graphs
#Company Introduction #Market and Competitor Analysis #Diagram
