Status Analysis Donut Chart – Shareholder Status Analysis
RM0300005_7
- Last Update 02/08/2025
- File Size 1.3MB
- # of Slides 2
- File Format PPTX
- Slide Ratio 16:9
- Color
Keywords
- #Content-Based Slides
- #Design-Based Slides
- #Company Introduction
- #Market and Competitor Analysis
- #Diagram
- #Graph
- #Shareholder Structure
- #Market Analysis
- #Table
- #Circles
- #Standard Table
- #Doughnut Chart
- #16:9
- #donut chart PowerPoint slide
- #pie chart template
- #shareholder analysis slide
- #4-segment donut chart
- #how to create donut chart in PowerPoint
About the Product
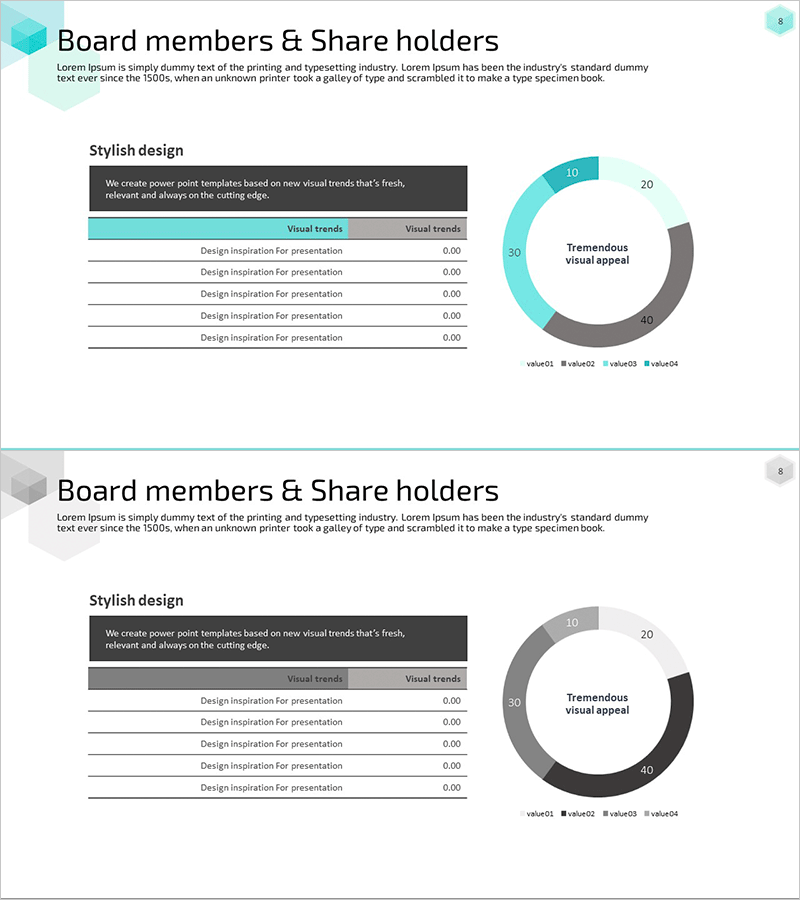
A donut chart PowerPoint slide designed for shareholder composition analysis. This circular graph template visualizes four data series using a striking color palette of teal, gray, and black segments. Each section displays clear numerical labels to communicate shareholding proportions at a glance. The 2-slide set is optimized for standard 16:9 widescreen format and includes a reference table with legend information. Perfect for corporate presentations, shareholder meetings, and investor relations materials that require clear data visualization of ownership structure.
Usage Points
-
Main Usage
Visualize corporate shareholding structure using a donut chart to clearly communicate ownership composition in shareholder meetings, investor presentations, and corporate overview decks. The four-segment design effectively displays proportional data for strategic decision-making and stakeholder communication.
-
How to Use
Open the slide and replace the donut chart data values with your actual shareholder percentages. Update the legend text and numerical labels to reflect your company's ownership structure. Customize colors if needed to align with your corporate branding guidelines.
-
Recommended For
Finance teams, investor relations (IR) professionals, and executives presenting shareholder composition. Ideal for annual shareholder meetings, investor disclosure documents, corporate earnings presentations, M&A negotiation materials, and regulatory filings.
-
Slide Structure
Two-slide template featuring a centered donut chart with four colored segments, numerical labels positioned at top-right (10, 20, 30, 40), and a reference table with legend on the lower-left. Teal serves as the primary accent color while gray and black provide supporting visual hierarchy.
Related Products
-

Detailed Analysis of Shareholder Status Donut Chart
#Company Introduction #Market and Competitor Analysis #Diagram
-

Visualizing Board Members and Shareholders with a Sleek Diagram
#Company Introduction #Market and Competitor Analysis #Diagram
-

Shareholder Status Distribution Analysis Chart – Visualizing Shareholder Information
#Company Introduction #Market and Competitor Analysis #Diagram
-

Shareholder Status Analysis Donut Chart – Insights and Analysis
#Company Introduction #Market and Competitor Analysis #Diagram
