Shareholder Status Analysis Chart & Description – Sleek Diagram
RM0300010_7
- Last Update 02/09/2025
- File Size 1MB
- # of Slides 2
- File Format PPTX
- Slide Ratio 16:9
- Color
Keywords
- #Content-Based Slides
- #Design-Based Slides
- #Company Introduction
- #Market and Competitor Analysis
- #Diagram
- #Graph
- #Shareholder Structure
- #Market Analysis
- #Table
- #Circles
- #Standard Table
- #Doughnut Chart
- #16:9
- #donut chart PowerPoint slide
- #pie chart template
- #shareholder analysis diagram
- #5-segment ratio chart
- #how to create donut chart in PowerPoint
About the Product
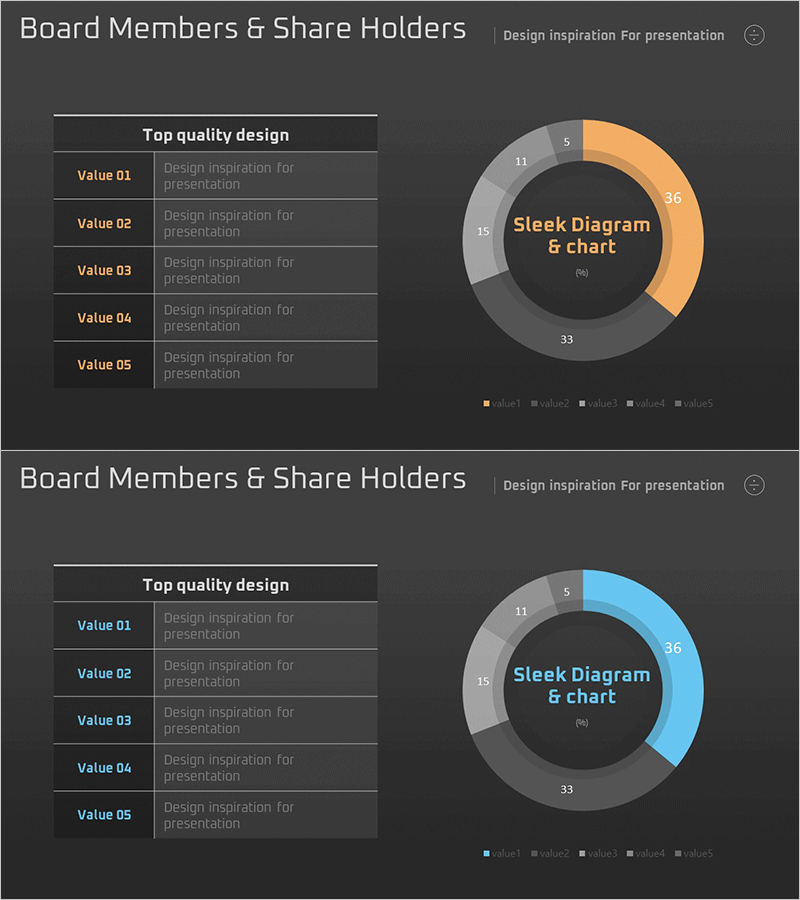
A 2-slide PowerPoint presentation featuring a donut chart for shareholder status analysis and market composition visualization. The design places a central title area within the donut ring, with five segments displayed in orange, gray, and black tones. A text box on the left accommodates descriptions for each segment. This template is optimized for presenting ratio-based data such as shareholding distribution, market share, and asset allocation in business reports and investor presentations.
Usage Points
-
Main Usage
Visualizes the proportion of each category relative to the whole, such as shareholder composition, market share, or asset distribution. The central donut area can highlight key metrics or titles, while the five external segments allow comparison of up to five categories simultaneously.
-
How to Use
Enter item names and descriptions in the left text box, then update the donut chart segment values. Colors can remain in the original orange-gray-black palette or be customized to match corporate branding. The two-slide format enables comparative analysis or year-over-year trend visualization.
-
Recommended For
Financial reports, shareholder meetings, management analysis presentations, market research reports, and business performance summaries. Ideal for CFOs, finance managers, executives, and marketing teams presenting quantitative data to stakeholders and investors.
-
Slide Structure
Two-slide layout with left-aligned text box (five rows for item names and descriptions) and right-aligned donut chart (central title area plus five external segments). First slide features orange accent; second slide uses blue accent for flexible variation.
Related Products
-

Shareholder Status Survey Donut Graph – Optimized for Market Analysis
#Company Introduction #Market and Competitor Analysis #Diagram
-

Shareholder Status Analysis Donut Chart – Insights and Analysis
#Company Introduction #Market and Competitor Analysis #Diagram
-

Shareholder Status Analysis Donut Pie Chart – Corporate Growth and Competitive Analysis
#Company Introduction #Market and Competitor Analysis #Diagram
-

Shareholder Status Distribution Analysis Chart – Visualizing Shareholder Information
#Company Introduction #Market and Competitor Analysis #Diagram
