Key Business Performance Analysis Chart – A Measure of Trust
RM0200011_6
- Last Update 02/04/2025
- File Size 1MB
- # of Slides 2
- File Format PPTX
- Slide Ratio 16:9
- Color
Keywords
- #Content-Based Slides
- #Design-Based Slides
- #Company Introduction
- #Market and Competitor Analysis
- #Diagram
- #Graph
- #Key Achievements
- #Market Analysis
- #Table
- #Horizontal Bar
- #Horizontal Bar Chart
- #16:9
- #horizontal bar chart PowerPoint
- #comparison analysis slide template
- #business performance chart
- #data visualization PowerPoint
- #bar graph slide design
About the Product
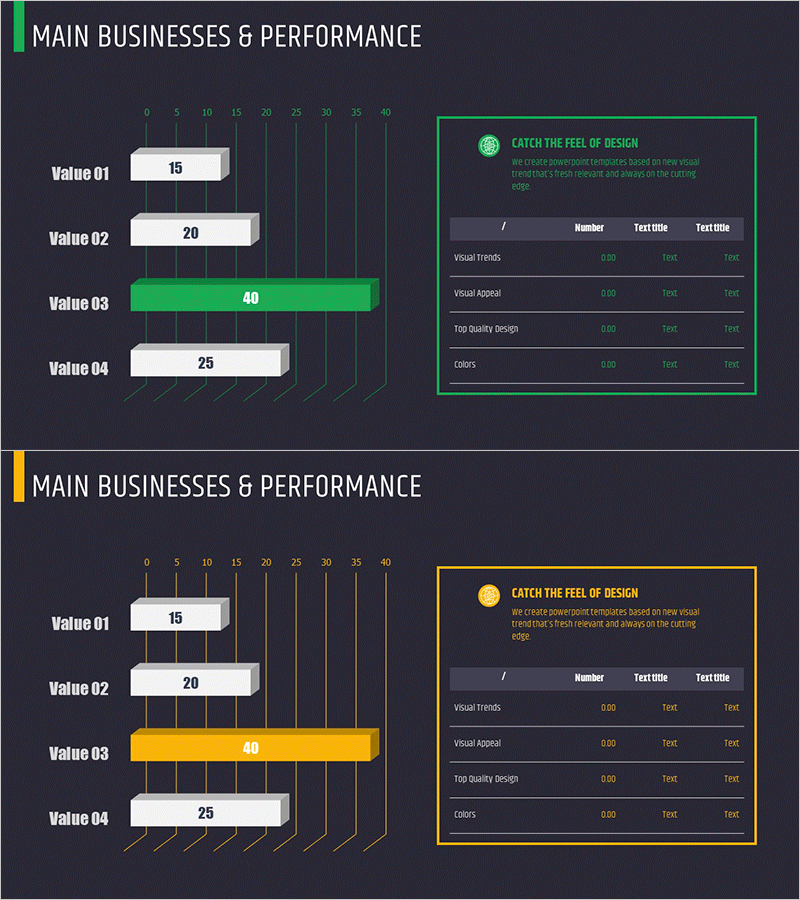
A horizontal bar chart PowerPoint slide for comparing four key business performance metrics and analysis data. This presentation template features two color versions with green and yellow accent colors on a dark background, with each bar displaying values on a 0-40 scale. The right side includes an information table with four evaluation criteria: Visual Trends, Visual Appeal, Design Quality, and Colors. This slide deck is ready to use for business reports, performance analysis presentations, market research findings, and executive briefings.
Usage Points
-
Main Usage
Visualize business metrics, performance indicators, and market analysis data across four comparable items. The bar length intuitively represents numerical differences, while the information table on the right provides evaluation criteria for credible analytical presentations.
-
How to Use
Insert your four data points into the bar chart for performance analysis sections, competitive comparisons, or market research results. Choose the green version to emphasize positive performance or the yellow version to highlight areas requiring attention.
-
Recommended For
Executive briefings, investor presentations, marketing team performance reviews, sales results analysis meetings, and quarterly business reviews. Ideal for data-driven decision-making presentations requiring quantitative comparison.
-
Slide Structure
Two-slide set. Each slide features a horizontal bar chart on the left with four items (Value 01-04) and an evaluation table on the right with Visual Trends, Visual Appeal, Design Quality, and Colors metrics. Dark background with green or yellow accent borders and bar fills.
Related Products
-

Key Performance Comparison Analysis Bar Graph
#Company Introduction #Market and Competitor Analysis #Diagram
-

Performance Analysis 3D Bar Chart & Table – Market and Performance Analysis
#Company Introduction #Market and Competitor Analysis #Diagram
-

Future Outlook & Competitor Analysis Chart
#Company Introduction #Market and Competitor Analysis #Diagram
-

Financial Status and Revenue Structure Analysis Chart – Business Insights
#Business Introduction #Market and Competitor Analysis #Diagram
