Future Technology Business Analysis Chart – Performance Focus
RM0200015_6
- Last Update 02/05/2025
- File Size 0.8MB
- # of Slides 2
- File Format PPTX
- Slide Ratio 16:9
- Color
Keywords
- #Content-Based Slides
- #Design-Based Slides
- #Company Introduction
- #Market and Competitor Analysis
- #Graph
- #Key Achievements
- #Market Analysis
- #Column
- #Grouped Column
- #16:9
- #grouped bar chart PowerPoint
- #dual series chart template
- #business analysis slide
- #performance comparison graph
- #bar chart PowerPoint slide design
About the Product
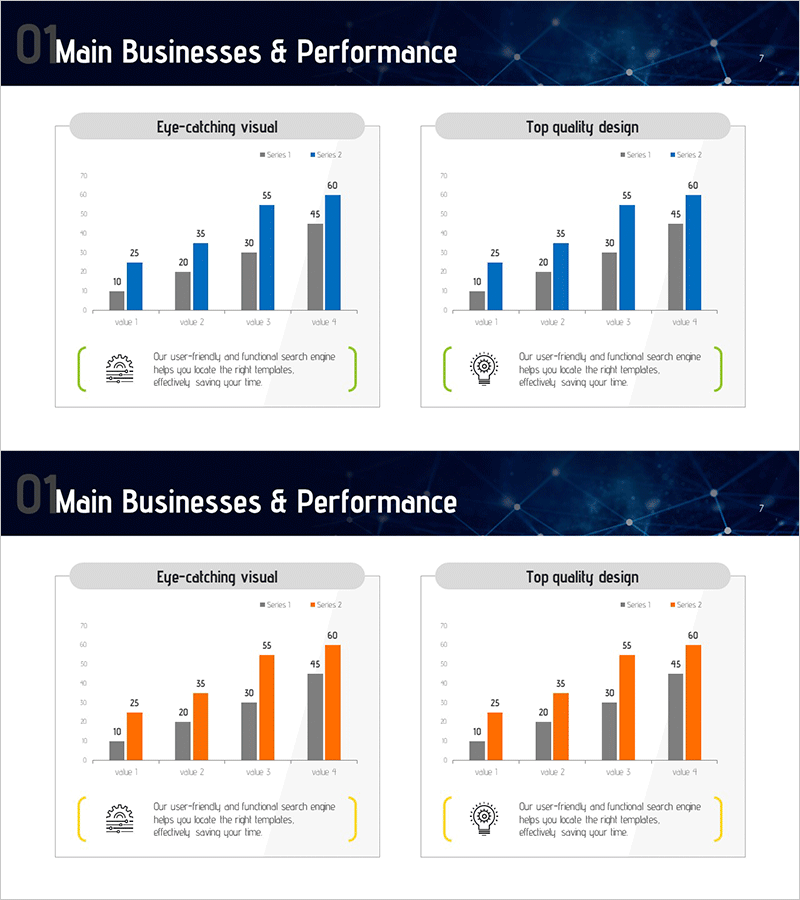
A grouped bar chart PowerPoint slide designed for business performance analysis and market comparison. This presentation template visualizes dual-series data across four items using both horizontal and vertical bar formats, set against a dark navy background with contrasting gray and blue color schemes. Each slide features 'Eye-catching visual' and 'Top quality design' sections, making it immediately applicable for future technology business analysis, competitive benchmarking, and performance reporting. Provided as an editable 2-slide PPTX file in 16:9 widescreen format.
Usage Points
-
Main Usage
Optimized for business performance analysis, competitive market comparison, and future technology industry trend presentations. The grouped bar layout enables intuitive side-by-side comparison of two data series across multiple items, making it ideal for executive reports, investor presentations, and strategic planning meetings.
-
How to Use
Select horizontal bar format when item names are lengthy; use vertical bars to emphasize time progression or sequence. Double-click data values (10, 25, 35, 55, 60, etc.) to edit, and customize series colors (gray and blue) to match your corporate branding. Legends and titles are fully editable.
-
Recommended For
Executives, business analysts, marketing teams, financial analysts, and consultants presenting quarterly performance reports, departmental business comparisons, and competitive benchmarking analyses. Particularly effective when comparing two metrics simultaneously across multiple categories.
-
Slide Structure
Both slides follow identical layout: dark navy header bar at top (title area), two chart zones in center (horizontal bars on left, vertical bars on right), and icon with descriptive text box at bottom. Each chart displays 4 items (ISSUE 1–4) with 2 data series (Series 1 and 2), with clearly labeled data points.
Related Products
-

Sales & Performance Status Slide – Data-Driven Insights
#Company Introduction #Market and Competitor Analysis #Diagram
-

Bio Industry Status Analysis Chart
#Company Introduction #Market and Competitor Analysis #Diagram
-

Year-by-Year Comparison Analysis Bundle Graph – Visualizing Market Performance
#Company Introduction #Market and Competitor Analysis #Diagram
-

Data-driven Market Analysis Strategy – Sleek Graph Slide
#Company Introduction #Market and Competitor Analysis #Graph
