Astronomy Themed Bundle Bar – Market Analysis Slide
RJ0700003_20
- Last Update 07/22/2025
- File Size 0.4MB
- # of Slides 2
- File Format PPTX
- Slide Ratio 16:9
- Color
Keywords
- #Content-Based Slides
- #Design-Based Slides
- #Market and Competitor Analysis
- #Graph
- #Market Analysis
- #Horizontal Bar
- #Grouped Horizontal Bar
- #16:9
- #horizontal bar chart PowerPoint
- #grouped bar graph template
- #market analysis slide
- #multi-series chart
- #astronomy theme presentation
- #comparative data visualization
About the Product
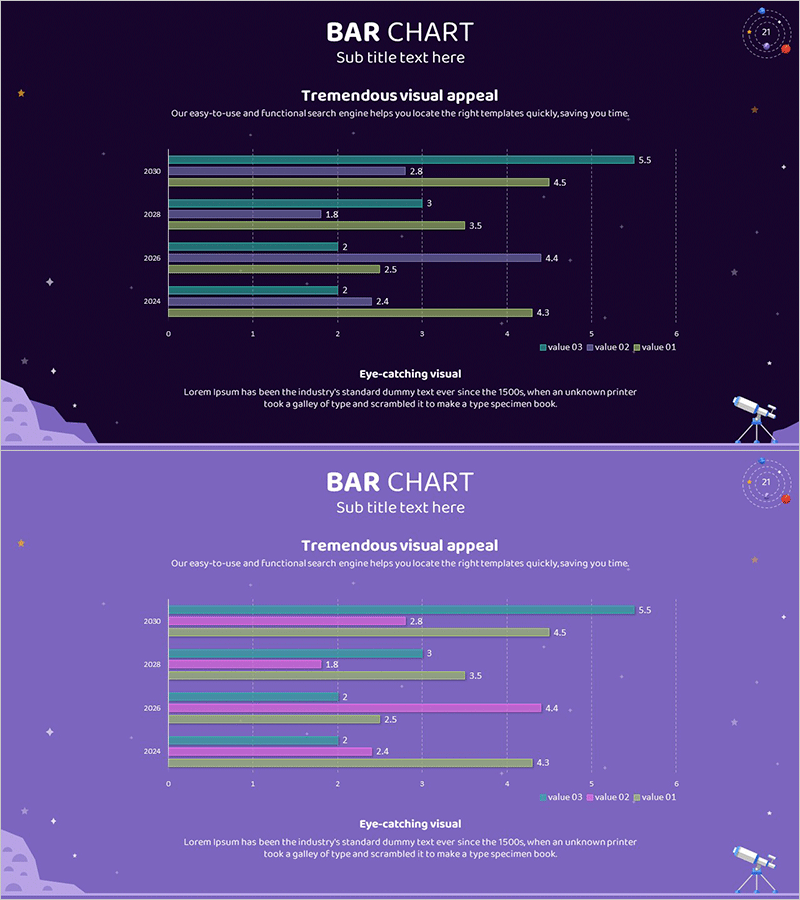
A horizontal bar chart PowerPoint slide featuring an astronomy-themed cosmic background with star decorations. This grouped bar structure compares three data series across five years (2024–2030), enabling simultaneous visualization of multiple metrics such as market size, revenue, and growth rate. The dark purple background contrasts with cyan, pink, and gray bar colors for excellent data readability, with clear numerical labels displayed for each year. The 16:9 widescreen format with 2-slide composition is ready for immediate use in market analysis presentations, competitive benchmarking, and revenue trend reports.
Usage Points
-
Main Usage
This market analysis slide compares multiple data points across years and categories using grouped horizontal bars. By visualizing three or more metrics simultaneously—such as revenue, market share, and growth rate—it supports data-driven decision-making in executive reports, investor presentations, and strategic planning meetings.
-
How to Use
Bar length and color intuitively represent data magnitude and series differentiation. Edit the numerical labels to input your actual revenue, market size, or growth rate data, and modify the legend to reflect your metric names. The slide is immediately ready for presentation use.
-
Recommended For
Ideal for executives, finance teams, marketing departments, and strategic planning teams presenting quarterly or annual performance reports, market size analysis, competitive comparisons, and revenue trend forecasts. Particularly effective for business reports, investor briefings, and strategic meetings requiring simultaneous comparison of three or more indicators.
-
Slide Structure
Two-slide composition with each slide displaying a horizontal bar chart. Five years (2024–2030) are positioned on the Y-axis with a numerical scale of 0–5.5 on the X-axis. Three data series (value 03, value 02, value 01) are grouped by year and color-coded in cyan, pink, and gray. Astronomy-themed cosmic background with star and telescope icons serve as decorative elements.
Related Products
-

Visual Trend Presentation Slide with Graphs
#Market and Competitor Analysis #Graph #Market Analysis
-

Company Status Analysis Slide – Market and Competitor Analysis
#Company Introduction #Market and Competitor Analysis #Graph
-

Cybersecurity Business Market Analysis Graph
#Market and Competitor Analysis #Graph #Competitor Analysis
-

Competitor Year-over-Year Comparison Analysis Bar Graph – Essential Tool for Market Analysis
#Market and Competitor Analysis #Graph #Competitor Analysis
