Multinational Market Analysis Indicators – Visualizing Market and Performance
RM0300008_17
- Last Update 02/08/2025
- File Size 8.6MB
- # of Slides 2
- File Format PPTX
- Slide Ratio 16:9
- Color
Keywords
- #Content-Based Slides
- #Design-Based Slides
- #Company Introduction
- #Market and Competitor Analysis
- #Diagram
- #Graph
- #Key Achievements
- #Market Analysis
- #Table
- #Line
- #Line Chart
- #16:9
- #line chart PowerPoint slide
- #market analysis presentation template
- #performance metrics visualization
- #trend comparison chart
- #multinational market slide download
About the Product
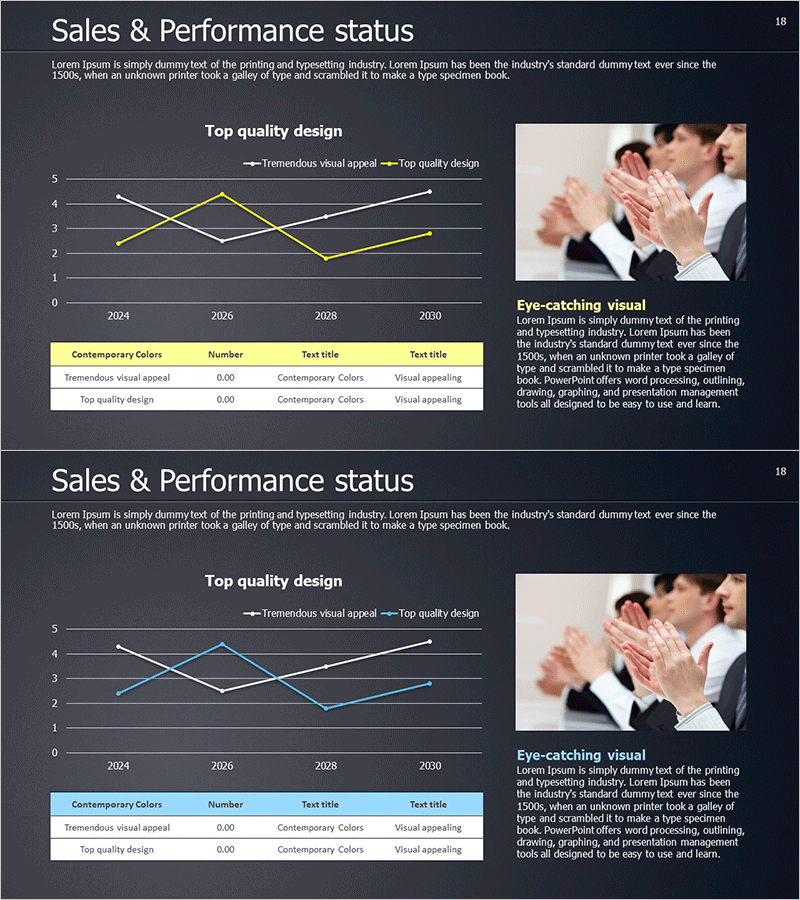
A line chart PowerPoint slide designed to visualize multinational market analysis and performance indicators. This presentation slide features two data series with trend lines that enable simultaneous comparison of market changes and performance metrics over time, from 2024 to 2030. The dark background with yellow and white accent lines creates strong visual contrast for professional impact. The slide is fully editable, allowing you to customize colors, data points, and labels to match your specific market analysis needs. Perfect for business presentations, performance reports, and investor pitch decks.
Usage Points
-
Main Usage
This slide is designed to compare multinational market performance indicators and market change trends across time periods. The dual-line format effectively displays the correlation and pattern changes between two performance metrics, making it ideal for market analysis reports, business performance presentations, and investor relations meetings.
-
How to Use
Simply replace the existing data points and legend with your own market performance data. You can easily modify the yellow and white line colors to match your company's brand palette using PowerPoint's built-in editing tools. Update the years and numerical values directly in the slide, and the chart will automatically adjust. The high-contrast lines on the dark background ensure clear visibility in projection environments.
-
Recommended For
Market analysts, business development teams, financial analysts, and executive presenters benefit most from this template. It is particularly useful for regional performance comparisons in multinational corporations, industry trend analysis, quarterly earnings presentations, and investor briefings. Recommended for inclusion in market analysis sections of marketing plans, business proposals, and performance reports.
-
Slide Structure
Two-slide set featuring a dual-series line chart with data points spanning 2024–2030. The first slide displays yellow and white trend lines, while the second slide presents a variation with blue series added. Both slides include a legend and data table at the bottom (Contemporary Colors, Number, Text title fields) for presenting numerical information alongside the visual representation.
Related Products
-

Performance Comparison Analysis Graph – Data-Driven Visualization
#Company Introduction #Market and Competitor Analysis #Diagram
-

Year-by-Year Comparison Analysis Bundle Graph – Visualizing Market Performance
#Company Introduction #Market and Competitor Analysis #Diagram
-

Company Financial Status Analysis Chart – Vision for Business Growth
#Business Introduction #Market and Competitor Analysis #Diagram
-

Presentation Slide Visualizing Company Performance with Column Chart
#Company Introduction #Market and Competitor Analysis #Diagram
