Current Status Dominance Analysis Chart – Visualizing Competitive Advantage
RM0300011_7
- Last Update 02/10/2025
- File Size 0.3MB
- # of Slides 2
- File Format PPTX
- Slide Ratio 16:9
- Color
Keywords
- #Content-Based Slides
- #Design-Based Slides
- #Company Introduction
- #Market and Competitor Analysis
- #Diagram
- #Graph
- #Shareholder Structure
- #Competitive Advantage
- #Table
- #Circles
- #Standard Table
- #Doughnut Chart
- #16:9
- #donut chart PowerPoint
- #pie chart slide template
- #ratio analysis diagram
- #competitive advantage visualization
- #donut graph presentation
- #data visualization PowerPoint slide
About the Product
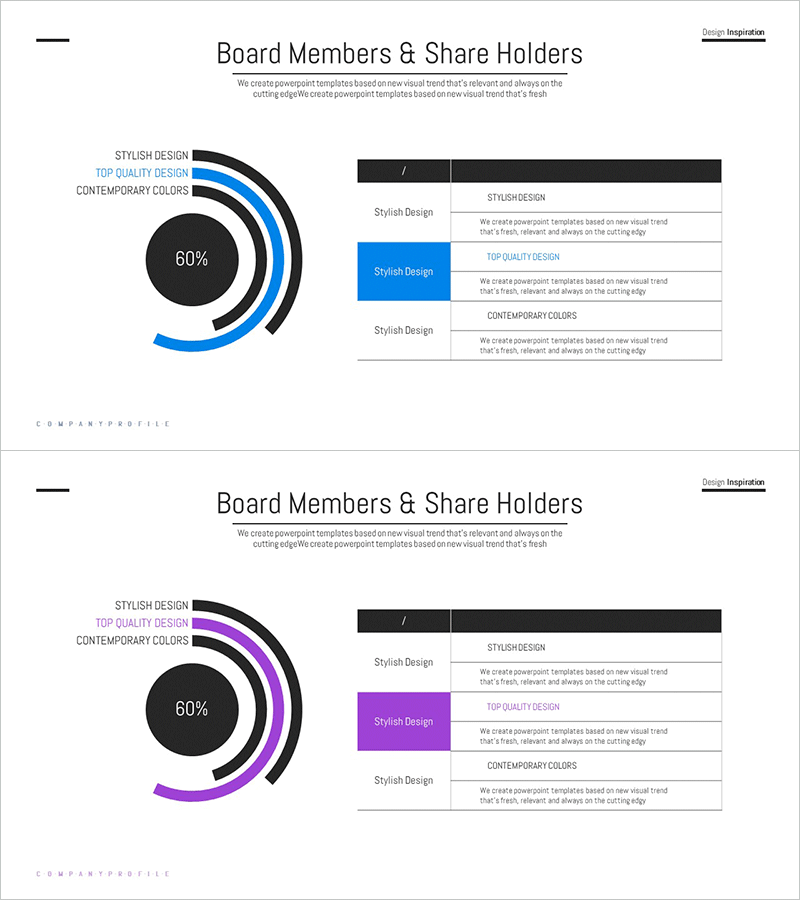
A PowerPoint slide featuring a central circular area displaying 60% with surrounding donut-shaped rings representing three categories (Stylish Design, Top Quality Design, Contemporary Colors) in a hierarchical structure. The blue and purple dual-tone ring design intuitively visualizes ratio-based data such as current status analysis, competitive advantage, shareholder composition, and market analysis. The right-side table area allows detailed descriptions for each category, making it ideal for presentations, reports, and proposals where key metrics need emphasis.
Usage Points
-
Main Usage
The donut chart emphasizes the proportion of specific items relative to the whole, with the central metric (60%) providing intuitive visualization of key performance indicators. Effectively captures audience attention when presenting ratio-based data such as competitive advantage, market share, and current status analysis.
-
How to Use
Input percentage values into the left donut chart and add category descriptions (Stylish Design, Top Quality Design, Contemporary Colors) in the right table. Place in current status analysis sections of business plans, investment pitch decks, marketing strategies, and product introductions to enhance data credibility.
-
Recommended For
Recommended for executives, marketing teams, sales professionals, and strategic planners presenting shareholder composition, market analysis, competitive advantage, and business status. Particularly valuable for investment pitches, business performance reports, and strategy presentations requiring ratio-based decision-making.
-
Slide Structure
Left side features a central circle (60% metric display) with three-layer donut rings (blue, purple, black hierarchy), while the right side contains a three-row table (category name and description in two columns). Two-slide set provides blue and purple versions, allowing color selection based on presentation context.
Related Products
-

Sensuous Doughnut Chart Slide – Market Share Analysis
#Market and Competitor Analysis #Diagram #Graph
-

Visualizing Board Members and Shareholders with a Sleek Diagram
#Company Introduction #Market and Competitor Analysis #Diagram
-

Shareholder Status Analysis Chart & Description – Sleek Diagram
#Company Introduction #Market and Competitor Analysis #Diagram
-

Key Competitive Factors in Market Analysis – First Step Toward Competitive Advantage
#Market and Competitor Analysis #Diagram #Graph
