Performance Advantage Analysis Chart – Evolving Business Success
RM0300011_17
- Last Update 02/09/2025
- File Size 1MB
- # of Slides 2
- File Format PPTX
- Slide Ratio 16:9
- Color
Keywords
- #Content-Based Slides
- #Design-Based Slides
- #Company Introduction
- #Market and Competitor Analysis
- #Diagram
- #Graph
- #Key Achievements
- #Future Outlook
- #Table
- #Horizontal Bar
- #Horizontal Bar Chart
- #16:9
- #bar chart PowerPoint slide
- #performance analysis chart template
- #comparison graph presentation
- #data visualization slide
- #multi-series bar chart download
About the Product
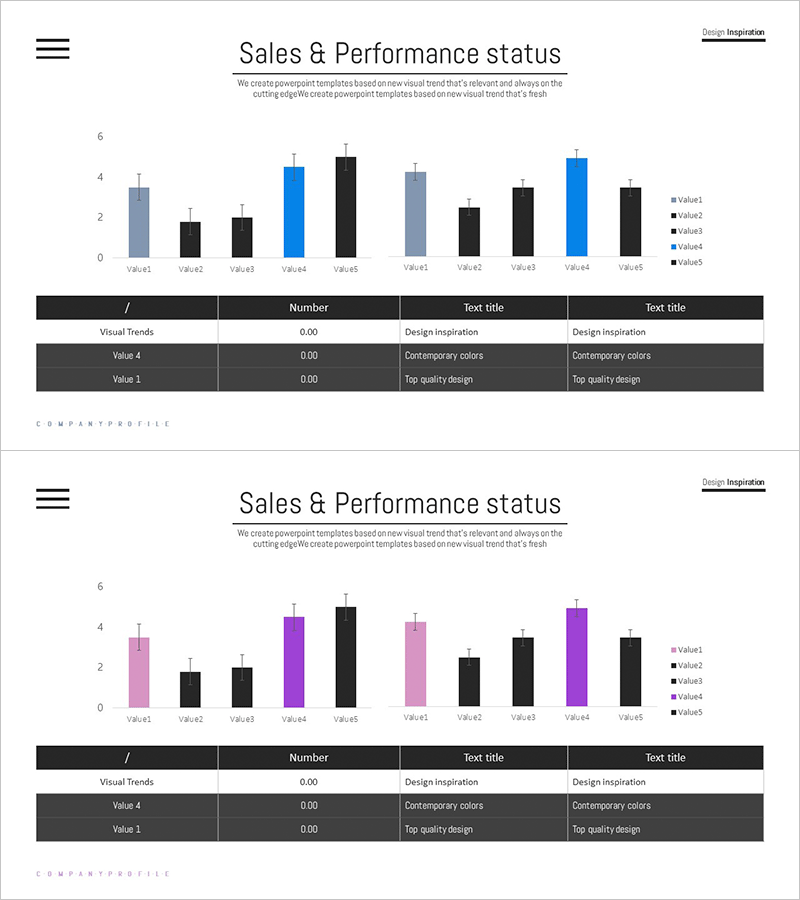
A bar chart PowerPoint slide designed for business performance analysis. This template visualizes quantitative data across five items using horizontal and vertical bar formats, with blue, black, and gray color series for multi-series data representation. Ideal for sales performance, departmental results, and competitive benchmarking presentations. The 2-slide set offers multiple color combinations and is fully editable in PPTX format for immediate use.
Usage Points
-
Main Usage
This slide presents quantitative performance data through bar chart comparison. It is used for sales reports, departmental performance reviews, quarterly trends, and competitive benchmarking. The multi-series structure allows simultaneous representation of multiple metrics and KPIs.
-
How to Use
Apply this template to executive reports, business performance presentations, marketing analysis documents, and investor pitch decks to provide quantitative evidence. Bar heights enable intuitive numerical comparison, while legends distinguish multiple data series. Colors can be customized to match your brand identity and corporate guidelines.
-
Recommended For
Finance, sales, and marketing professionals; executives; consultants; and analysts who base decisions on quantitative data. Suitable for quarterly and annual performance reviews, inter-departmental comparisons, market share analysis, and strategic planning presentations.
-
Slide Structure
The 2-slide set features a 5-item bar chart with dual color schemes. Slide 1 uses blue and black series; Slide 2 uses gray and black for alternative styling. Each slide includes Y-axis values, X-axis item labels, and a legend. Data input areas are clearly marked for easy customization.
Related Products
-

Bar Chart & Income Statement Table – Market Analysis and Financial Performance
#Market and Competitor Analysis #Financial Plans and Performance #Diagram
-

Key Performance Comparison Analysis Bar Graph
#Company Introduction #Market and Competitor Analysis #Diagram
-

Sales Outlook Analysis Chart – Sleek Data Visualization
#Market and Competitor Analysis #Financial Plans and Performance #Diagram
-

Sales Outlook Table & Bar Chart – Market and Financial Insights
#Market and Competitor Analysis #Financial Plans and Performance #Diagram
