Status Analysis Donut Chart – Visualizing Market and Shareholder Status
RM0300001_7
- Last Update 02/07/2025
- File Size 0.4MB
- # of Slides 2
- File Format PPTX
- Slide Ratio 16:9
- Color
Keywords
- #Content-Based Slides
- #Design-Based Slides
- #Company Introduction
- #Market and Competitor Analysis
- #Diagram
- #Graph
- #Shareholder Structure
- #Market Analysis
- #Table
- #Circles
- #Standard Table
- #Doughnut Chart
- #16:9
- #donut chart PowerPoint slide
- #pie chart template
- #4-segment ratio visualization
- #status analysis graph
- #shareholder composition chart
- #donut graph download
About the Product
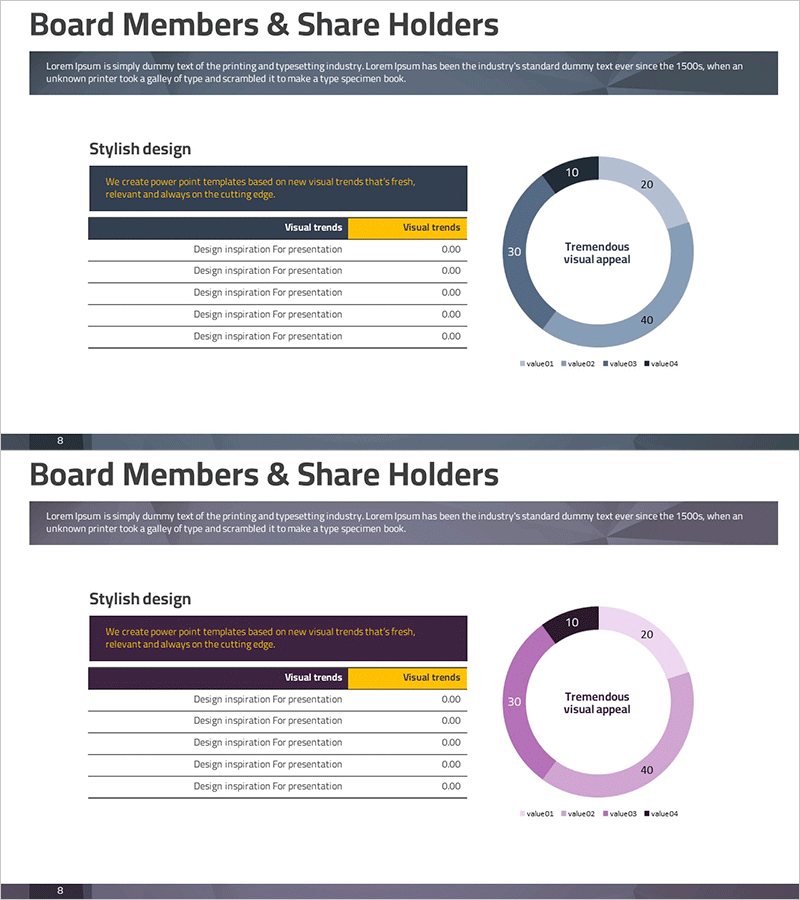
A 4-segment donut chart PowerPoint slide designed to visualize status analysis and shareholder composition with clarity and impact. The donut graph features a two-tone color scheme combining navy blue and brown tones, making it ideal for presenting market share, shareholder distribution, departmental proportions, and other ratio-based data. Delivered as 2 fully editable slides in 16:9 widescreen format (PPTX), ready for immediate use in presentations and reports. Each segment is independently customizable—change colors, update values, and adapt the chart to match your specific data structure without rebuilding from scratch.
Usage Points
-
Main Usage
Effectively communicate proportional data such as market share percentages, shareholder composition, departmental budget allocation, and customer distribution. The hollow center of the donut provides space to highlight key metrics or titles, enhancing information hierarchy and visual appeal.
-
How to Use
Insert into business plans (market analysis section), investor pitch decks (shareholder overview), quarterly performance reports (results breakdown), and company profiles (organizational structure). Double-click any segment to edit values and colors directly. Drag legend items to reposition as needed for your layout.
-
Recommended For
Finance teams presenting quarterly results, marketing departments analyzing market segments, executives preparing shareholder meetings, consulting firms delivering status reports, and educators visualizing statistical data. Ideal for any role working with ratio-based or compositional datasets.
-
Slide Structure
2-slide deck featuring a centered 4-segment donut chart on each slide. Color-coded segments in navy blue, brown, gray, and light blue with a legend positioned to the right. Includes dedicated text fields for segment labels and percentage values. Optimized for 16:9 widescreen displays with professional spacing and alignment.
Related Products
-

Detailed Analysis of Shareholder Status Donut Chart
#Company Introduction #Market and Competitor Analysis #Diagram
-

Visualizing Board Members and Shareholders with a Sleek Diagram
#Company Introduction #Market and Competitor Analysis #Diagram
-

Shareholder Status Distribution Analysis Chart – Visualizing Shareholder Information
#Company Introduction #Market and Competitor Analysis #Diagram
-

Shareholder Status Analysis Slide – Data-Driven Market Insights
#Company Introduction #Market and Competitor Analysis #Diagram
