Colorful Donut Chart & Table – Emphasizing Visual Data
RM0300004_7
- Last Update 02/07/2025
- File Size 0.3MB
- # of Slides 2
- File Format PPTX
- Slide Ratio 16:9
- Color
Keywords
About the Product
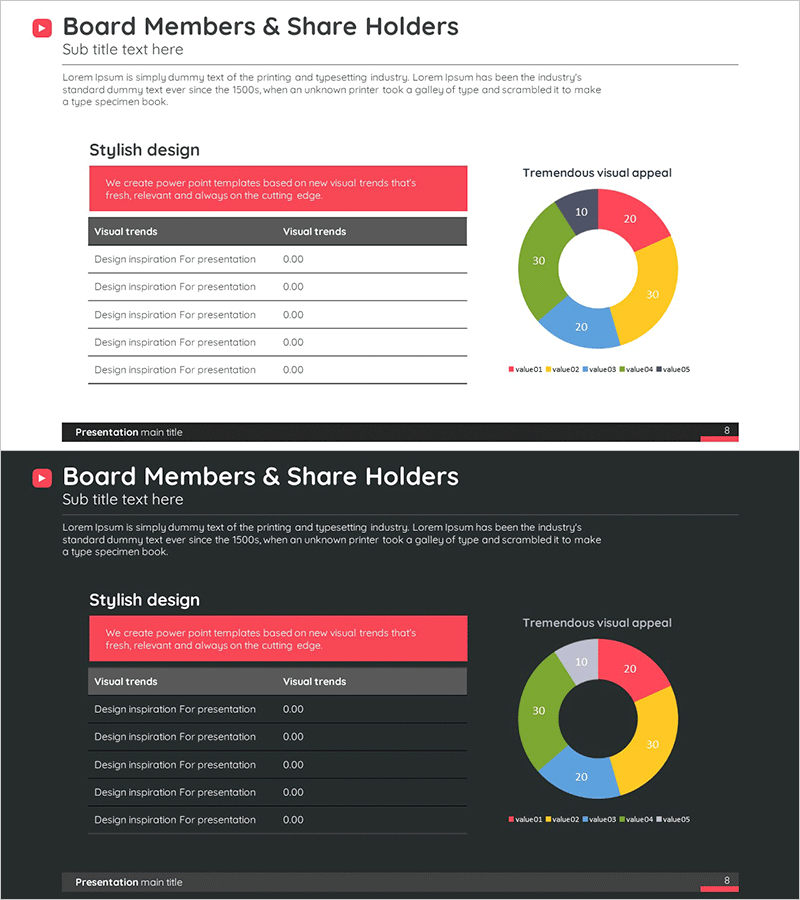
A 2-slide PowerPoint presentation set combining a donut chart and data table for business reporting. The circular graph features four color segments—red, green, blue, and yellow—optimized for ratio representation, while the accompanying table organizes numerical data in structured rows and columns. Designed for 16:9 widescreen format, these slides integrate seamlessly into company overviews, business status updates, market analysis presentations, and financial reports. Use this PowerPoint slide template to emphasize quantitative information visually and present supporting data simultaneously in your presentation materials.
Usage Points
-
Main Usage
The donut chart clearly displays the proportion of each segment relative to the whole, while the table presents exact numerical values side by side. Ideal for communicating revenue composition, market share, budget allocation, customer distribution, and other ratio-based metrics.
-
How to Use
Use the first slide to visualize overall composition with the donut chart, then add detailed figures and descriptions in the table on the second slide. Edit colors and numbers to match your specific data, and customize text labels for your presentation context.
-
Recommended For
Finance reports, quarterly business reviews, marketing analysis, performance summaries, customer segmentation studies, and executive presentations requiring proportion-based data explanation.
-
Slide Structure
Slide 1: 4-segment donut chart (red 20, green 30, blue 20, yellow 30 proportions) with legend. Slide 2: 5-row × 2-column data table with item name and value fields, plus description text area. Full 16:9 aspect ratio, PPTX format.
Related Products
-

Market Outlook Segmentation Analysis Graph – Strengthening Business Strategy
#Company Introduction #Market and Competitor Analysis #Diagram
-

Graph Slide for Market and Competitor Analysis – Online Market Overview
#Market and Competitor Analysis #Diagram #Graph
-

Share Analysis of Two Topics with Pie Chart
#Market and Competitor Analysis #Diagram #Graph
-

Cluster Slide Visualizing Preference for Water Activities
#Business Strategy #Market and Competitor Analysis #Diagram
