Key Performance Bar & Line Analysis Chart – Integrated Market Performance Visualization
RM0300004_17
- Last Update 02/07/2025
- File Size 0.3MB
- # of Slides 2
- File Format PPTX
- Slide Ratio 16:9
- Color
Keywords
- #Content-Based Slides
- #Design-Based Slides
- #Company Introduction
- #Market and Competitor Analysis
- #Graph
- #Key Achievements
- #Market Analysis
- #Horizontal Bar
- #Line
- #Horizontal Bar Chart
- #Line Chart
- #16:9
- #dual-axis chart PowerPoint
- #bar and line graph template
- #performance analysis slide
- #data visualization PPT
- #sales trend chart download
About the Product
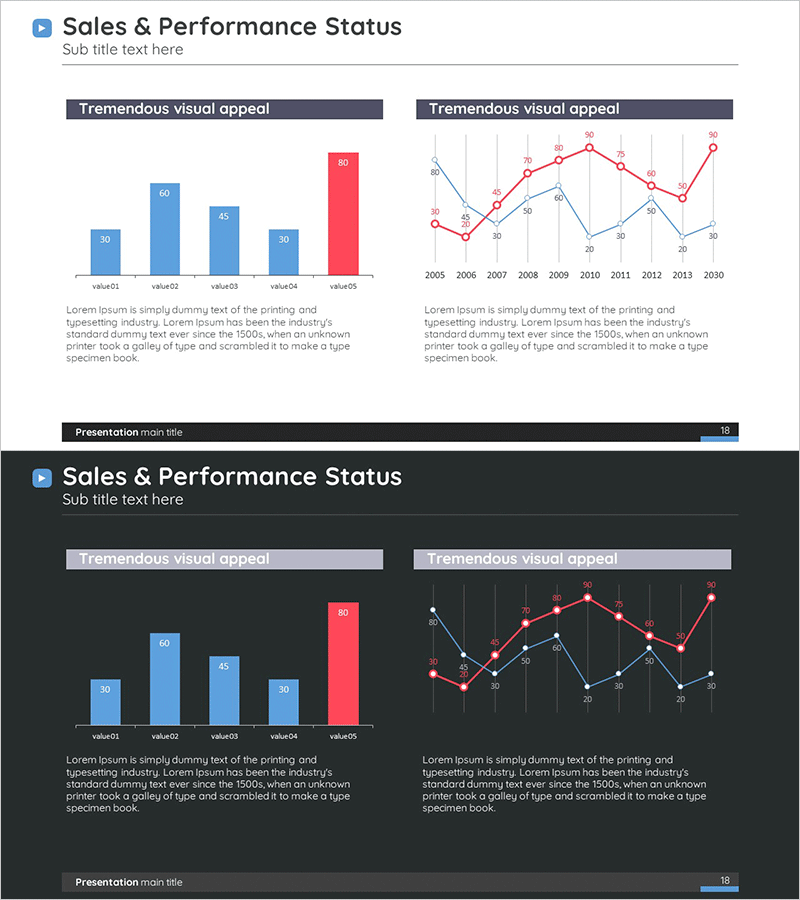
A dual-axis chart PowerPoint slide that displays sales performance and trend analysis simultaneously. This slide combines a bar graph and line graph to compare data with different units on a single screen. Two versions are provided: light background and dark background, with clear color differentiation between blue bars and red line for enhanced data readability. The slide includes title, legend, and data labels for immediate customization and use. Formatted in 16:9 PPTX with 2 slides total.
Usage Points
-
Main Usage
Designed to compare two datasets with different units on a single slide. Ideal for expressing metrics such as sales volume versus growth rate, or revenue versus profit margin. Effectively communicates time-series data changes and trends across multiple years.
-
How to Use
Use the light background version for printed materials or bright presentation environments, and the dark background version for projector presentations or online meetings. Double-click the legend and data labels to replace with actual figures, and adjust bar and line colors as needed.
-
Recommended For
Recommended for executive reports, quarterly performance presentations, marketing performance analysis, financial status explanations, and investor presentations. Suitable for sales teams, marketing teams, and finance teams presenting data-driven decision-making materials.
-
Slide Structure
Each slide consists of a title area, dual-axis chart area, and legend area. The chart includes bar data for 5 items (value01-value05) and line trend data from 2005 to 2030. Numeric labels appear at each data point for precise value verification.
Related Products
-

Multinational Market Analysis Indicators – Visualizing Market and Performance
#Company Introduction #Market and Competitor Analysis #Diagram
-

Key Business Performance Analysis Chart – A Measure of Trust
#Company Introduction #Market and Competitor Analysis #Diagram
-

Positive Performance Analysis Chart
#Company Introduction #Market and Competitor Analysis #Graph
-

Performance Comparison Analysis Line & Donut Chart – Data Visualization for Market Understanding
#Company Introduction #Market and Competitor Analysis #Graph
