Profit and Loss Statement Table – Clear Visualization of Financial Planning
RM0300002_24
- Last Update 02/07/2025
- File Size 4.2MB
- # of Slides 2
- File Format PPTX
- Slide Ratio 16:9
- Color
Keywords
- #Content-Based Slides
- #Design-Based Slides
- #Company Introduction
- #Financial Plans and Performance
- #Diagram
- #Contact Information
- #Income Statement
- #Table
- #16:9
- #profit and loss statement PPT slide
- #financial table PowerPoint design
- #P&L statement template slide
- #financial data visualization PowerPoint
- #how to create financial reports in PowerPoint
About the Product
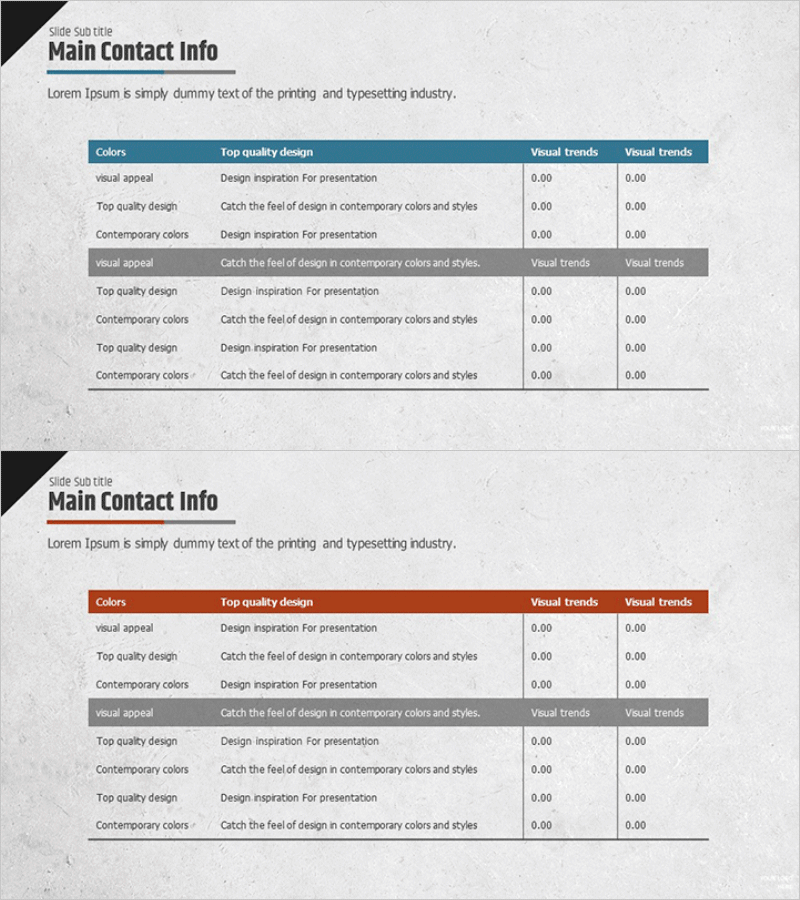
A professional profit and loss statement PowerPoint slide designed for financial planning and performance analysis. Features a dark blue header with white background table structure that clearly visualizes financial data across multiple periods or departments. The 2-slide set includes rows for revenue, expenses, and profit metrics with a 3-column comparison layout ideal for period-over-period or departmental performance presentations. Perfect for investor reports, quarterly earnings presentations, and executive briefings that require financial credibility and data clarity.
Usage Points
-
Main Usage
Communicate financial performance and P&L results with numerical precision and visual clarity. The dark blue header and aligned table structure enhance readability of financial metrics while supporting period-to-period and departmental comparative analysis. Strengthens investor confidence and supports executive decision-making.
-
How to Use
Insert into investor relations materials, quarterly earnings reports, and financial analysis presentations within the financial results section. Enter revenue, cost of goods sold, operating expenses, and net income in table rows, then input period-specific figures in columns. Use color highlighting to emphasize key performance indicators.
-
Recommended For
CFOs, financial controllers, investor relations managers, and executives presenting financial performance. Essential for public company quarterly earnings presentations, startup fundraising pitches, internal management review meetings, and financial stakeholder communications.
-
Slide Structure
2-slide set with first slide featuring dark blue header (Colors, Top quality design, Visual trends columns) and white data area, second slide offering alternative red header version. Each slide contains 8-row × 3-column table structure accommodating financial line items and multi-period numerical data entry.
Related Products
-

Key Financial Indicators Table – Essential Information Visualization
#Financial Plans and Performance #Diagram #Income Statement
-

Key Financial Indicators Table – Clear Profit Analysis
#Financial Plans and Performance #Diagram #Income Statement
-

Paper Theme Key Financial Indicators Slide
#Financial Plans and Performance #Diagram #Income Statement
-

Business Income Statement – Visualizing Financial Performance
#Financial Plans and Performance #Diagram #Income Statement
