Key Performance Analysis Vertical Bar Chart – Emphasizing Analysis and Growth
RM0300002_17
- Last Update 02/07/2025
- File Size 4.2MB
- # of Slides 2
- File Format PPTX
- Slide Ratio 16:9
- Color
Keywords
- #Content-Based Slides
- #Design-Based Slides
- #Company Introduction
- #Market and Competitor Analysis
- #Graph
- #Key Achievements
- #Market Analysis
- #Column
- #Column Chart
- #16:9
- #vertical bar chart PowerPoint
- #bar graph slide template
- #sales performance chart
- #data comparison visualization
- #how to create bar chart in PowerPoint
About the Product
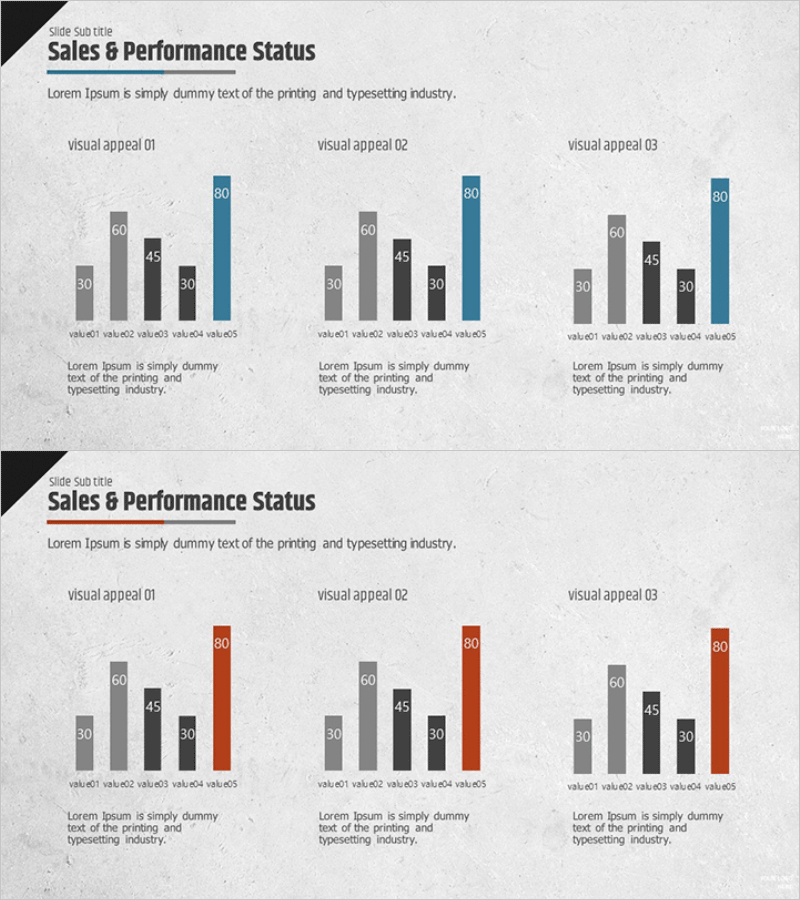
A vertical bar chart PowerPoint slide for comparing sales performance and key metrics across five data points. This presentation template uses gray, black, and blue color schemes to distinguish between val-01 through val-05, making numerical comparisons and value highlighting straightforward. The 16:9 widescreen format includes two slides with three different visual representations per slide, allowing you to select the most effective data emphasis method for your audience. Ready to download and edit for immediate use in business presentations.
Usage Points
-
Main Usage
Display quantitative data such as sales figures, quarterly performance, departmental targets, or market share across five categories. The vertical bar format enables quick visual comparison of relative values, helping audiences grasp performance differences at a glance.
-
How to Use
Each slide presents the same dataset in three different visual styles: uniform item display, highest-value emphasis, and selective item highlight. Choose the slide layout that best matches your presentation narrative and audience focus.
-
Recommended For
Sales and marketing team quarterly performance reports, executive-level business results presentations, investor pitch decks, management consulting client analysis materials, educational institution student achievement comparisons, and corporate performance benchmarking sessions.
-
Slide Structure
Two-slide template. Each slide contains a title area and three vertical bar chart sections. Every chart displays five data items (val-01 through val-05) as vertical bars with numeric labels (30, 45, 60, 80) positioned above each bar. Gray, black, and blue color differentiation clarifies data series and highlights key values.
Related Products
-

Presentation Slide Visualizing Company Performance with Column Chart
#Company Introduction #Market and Competitor Analysis #Diagram
-

Analysis by Figures with Horizontal Bar Chart – Data-Driven Market Strategy
#Business Strategy #Market and Competitor Analysis #Graph
-

Target Country Analysis Bar Graph – Insights into Global Markets
#Company Introduction #Market and Competitor Analysis #Graph
-

Premium Management Presentation Template Map Analysis - Market Analysis and Innovative Strategy
#Market and Competitor Analysis #Marketing Plan and Strategy #Graph
