Global User Analysis Graph
RM0300002_11
- Last Update 02/07/2025
- File Size 4.7MB
- # of Slides 2
- File Format PPTX
- Slide Ratio 16:9
- Color
Keywords
- #Content-Based Slides
- #Design-Based Slides
- #Company Introduction
- #Market and Competitor Analysis
- #Graph
- #Other
- #Global Network
- #Market Analysis
- #Map
- #16:9
- #global network map PowerPoint
- #world distribution slide
- #global user analysis presentation
- #map-based data visualization slide
- #international business status PPT
About the Product
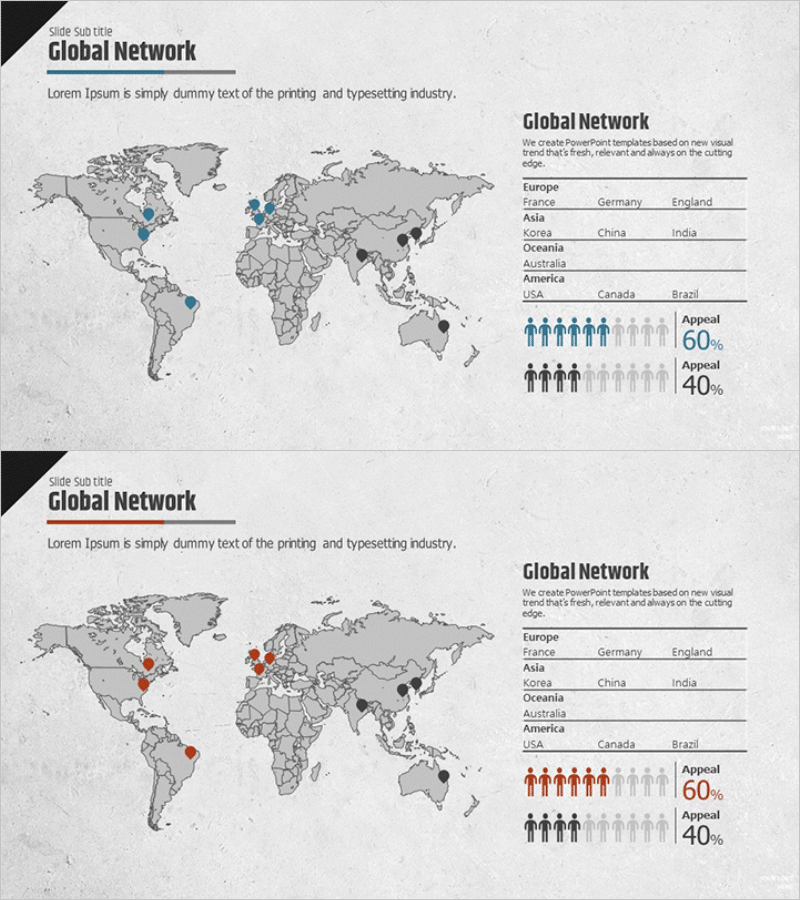
A PowerPoint slide that visualizes global business locations and user distribution across the world map. Key regional hubs are marked with blue point indicators on a world map, complemented by a regional country list and user percentage infographics. This presentation design effectively communicates your company's global network scale and market reach in corporate introductions, business status reports, and market analysis presentations. The 2-slide set features customizable marker colors (blue/red) for different data emphasis, optimized for 16:9 widescreen format.
Usage Points
-
Main Usage
Designed to visually represent global business hub distribution, international market expansion status, and regional user scale. The combination of world map point markers, regional country labels, and percentage data effectively conveys your organization's global network scope and market influence.
-
How to Use
Use in company profile presentations' global network section, business status reports, and investor pitch decks when explaining international hub distribution. Input actual data into the map markers and statistics area to customize the slide for your company's specific global operations.
-
Recommended For
Ideal for executives, business development teams, and marketing professionals at global enterprises presenting international market presence. Effectively communicates company scale to investors, partners, and new employees, building confidence in your organization's global reach.
-
Slide Structure
Two-column layout with a world map (gray tone) on the left showing key locations marked with blue or red point indicators, and a right panel containing regional country lists (Europe, Asia, Oceania, America) with user percentage infographics (60%, 40%). Includes title and descriptive text areas for flexible customization.
Related Products
-

Global Comparison of National Sustainability Contributions
#Company Introduction #Market and Competitor Analysis #Graph
-

Global Network Market Trends – Insights through Data Visualization
#Company Introduction #Market and Competitor Analysis #Graph
-

Global Market Analysis Map – Importance of Market Connectivity
#Company Introduction #Market and Competitor Analysis #Graph
-

Global Country Analysis Vertical Bar Graph – Market and Competitor Analysis
#Company Introduction #Market and Competitor Analysis #Graph
