Graph Slide Visualizing Investment Plan
RM0200020_6
- Last Update 11/10/2025
- File Size 5.5MB
- # of Slides 2
- File Format PPTX
- Slide Ratio 16:9
- Color
Keywords
- #Content-Based Slides
- #Design-Based Slides
- #Financial Plans and Performance
- #Graph
- #Capital Requirements
- #Horizontal Bar
- #Horizontal Bar Chart
- #16:9
- #horizontal bar chart PowerPoint
- #investment plan slide template
- #data comparison graph
- #financial presentation slides
- #budget allocation chart
- #how to create bar chart in PowerPoint
About the Product
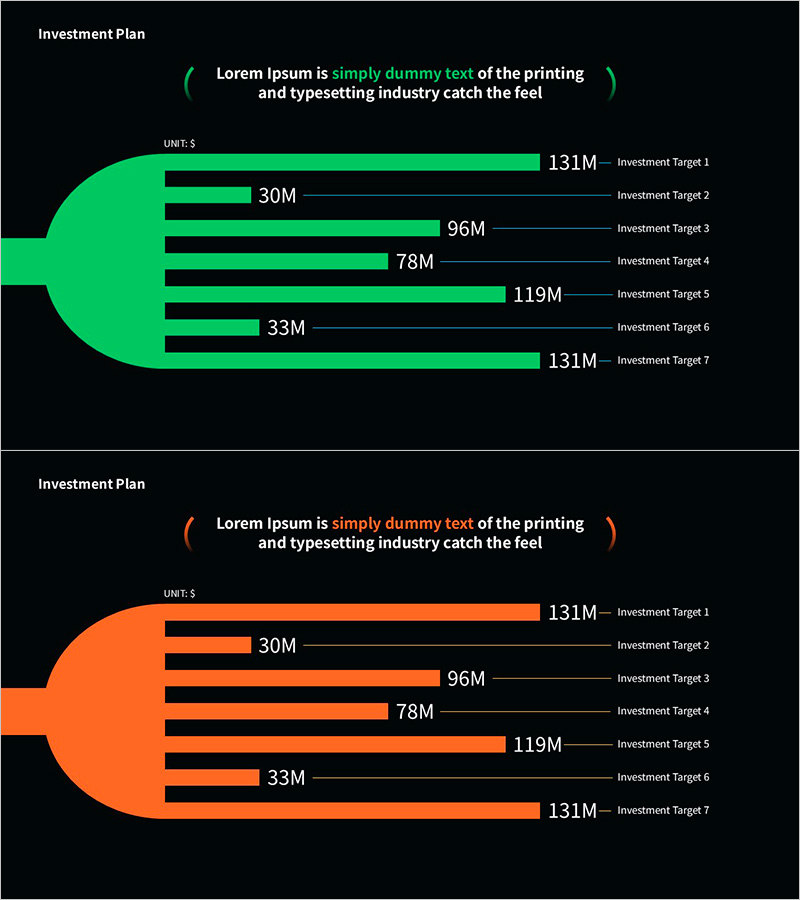
A horizontal bar chart PowerPoint slide that visualizes investment plan scale across seven targets in a single view. Available in two color versions—vibrant green and bright orange—each displaying investment amounts ranging from 131M to 30M. The design features a dark background with high-contrast colored bars and a circular icon on the left for visual emphasis. Provided in 16:9 aspect ratio PPTX format, fully editable and ready to use in financial reports, business plans, investment proposals, and executive presentations.
Usage Points
-
Main Usage
Displays investment scale, budget allocation, and funding targets as numerical data using bar length for intuitive comparison. The relative size differences between items are immediately clear, making it highly effective for presenting decision-making rationale.
-
How to Use
Insert into the investment planning section of financial reports, budget allocation slides in business plans, or budget breakdown presentations in investment proposals. Double-click values to edit directly, and select the color version that matches your presentation tone.
-
Recommended For
CFOs, finance managers, investment officers, business planners, and consultants who need to persuade through data-driven insights. Ideal for startup fundraising pitches, corporate financial disclosures, and departmental budget presentations.
-
Slide Structure
Two-slide set. First slide presents seven investment targets (131M, 30M, 96M, 78M, 119M, 33M, 131M) in green horizontal bars with a circular icon on the left and descriptive text area at the top. Second slide mirrors the same data structure in orange color version for flexible design options.
Related Products
-

Ranking Highlighting Bar Charts and Tables – Sales and Performance Management
#Financial Plans and Performance #Diagram #Graph
-

Horizontal Bar Chart with Highlighted Emphasis – Market and Competitive Analysis
#Market and Competitor Analysis #Graph #Future Outlook
-

Business Analysis Graph Slide - Market and Competitor Analysis
#Market and Competitor Analysis #Graph #Market Analysis
-

Notebook Configuration Analysis Graph – The Optimal Choice for Organizing Data
#Product/Service Introduction #Graph #Composition
