Business Analysis Graph Slide - Market and Competitor Analysis
RJ0300046_25
- Last Update 04/30/2025
- File Size 3.8MB
- # of Slides 2
- File Format PPTX
- Slide Ratio 16:9
- Color
Keywords
- #Content-Based Slides
- #Design-Based Slides
- #Market and Competitor Analysis
- #Graph
- #Market Analysis
- #Horizontal Bar
- #Horizontal Bar Chart
- #16:9
- #horizontal bar chart PowerPoint
- #bar graph slide template
- #comparison analysis chart
- #market analysis PowerPoint
- #competitor analysis slide
- #data visualization presentation
- #how to create bar chart in PowerPoint
About the Product
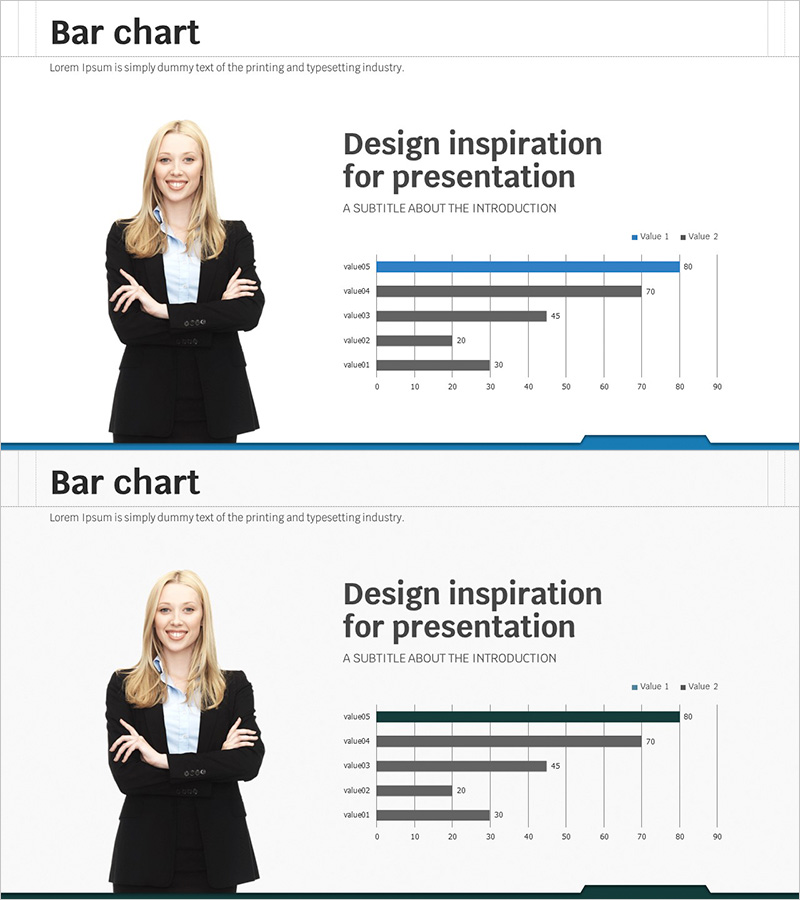
A professional horizontal bar chart PowerPoint slide designed for business analysis and market research presentations. The slide features five data items displayed with two series (blue and dark gray bars) for direct comparison of metrics such as market size, competitor performance, and sales figures. The layout includes a business professional image on the left, enhancing credibility and visual appeal. Optimized for 16:9 widescreen format, this PPTX template integrates seamlessly into presentation flows. All chart elements are fully editable, allowing you to quickly input your own data and customize labels.
Usage Points
-
Main Usage
Enables clear comparison of multiple data points—such as market size, competitor metrics, or sales performance—in business presentations. The dual-series design (blue primary, gray secondary) directs audience attention to key findings while maintaining visual hierarchy and data clarity.
-
How to Use
Replace the placeholder item names (value01–value05) and numerical values with your actual data. Update the legend labels (Value 1 and Value 2) to reflect your comparison categories. The gridlines aid in reading precise values. The business professional image can be removed or swapped with alternative imagery as needed.
-
Recommended For
Ideal for executives, marketing teams, and sales departments presenting market analysis, competitive benchmarking, departmental performance, and strategic insights. Suitable for business plans, quarterly reports, investor pitch decks, and strategic planning meetings.
-
Slide Structure
Two-slide deck: Title slide with 'Bar chart' heading and subtitle; data slide featuring five horizontal bars (value01–value05) with dual series (blue and gray) representing values 0–90. Left-aligned professional business image. Grid background supports accurate value interpretation.
Related Products
-

Competitor and Market Analysis Slide – Pink & Bluegreen PowerPoint Template
#Market and Competitor Analysis #Graph #Competitor Analysis
-

Illustration Brush Graph Analysis Slide
#Market and Competitor Analysis #Graph #Market Analysis
-

Space Industry Analysis Graph Chart – Market and Competitive Analysis
#Market and Competitor Analysis #Graph #Customer Analysis
-

Market Analysis Horizontal Bar Chart – Competitor Analysis
#Market and Competitor Analysis #Graph #Market Analysis
