Ranking Highlighting Bar Charts and Tables – Sales and Performance Management
RJ0500019_7
- Last Update 08/27/2025
- File Size 2.2MB
- # of Slides 2
- File Format PPTX
- Slide Ratio 16:9
- Color
Keywords
- #Content-Based Slides
- #Design-Based Slides
- #Financial Plans and Performance
- #Diagram
- #Graph
- #Capital Requirements
- #Sales and Revenue
- #Table
- #Horizontal Bar
- #Horizontal Bar Chart
- #16:9
- #horizontal bar chart PowerPoint
- #bar graph slide template
- #sales performance comparison
- #data visualization chart
- #chart and table combination slide
About the Product
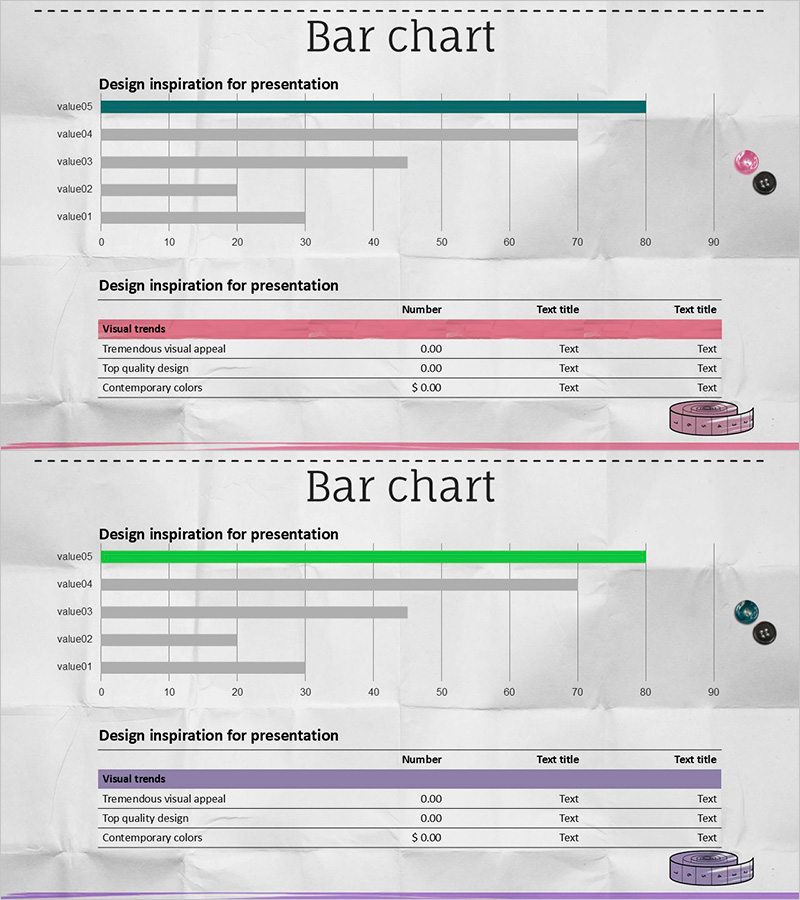
A PowerPoint slide combining horizontal bar charts and data tables for sales and performance management presentations. This design visualizes five data points using horizontal bars and includes a structured table below for detailed metrics (number, title, description). Four color versions—teal, pink, green, and purple—are provided to match your corporate branding or presentation theme. The 2-slide set is ready to use immediately in business reports and performance reviews.
Usage Points
-
Main Usage
This slide presents numerical comparison data—such as sales figures, departmental performance, product sales volume, or market share—using horizontal bar charts, with detailed metrics displayed in a table below. Ideal for executive reports, quarterly performance presentations, and marketing analysis materials.
-
How to Use
Enter your five data values in the horizontal bar chart at the top; the bar lengths adjust automatically. Fill in the table below with detailed information in the 'Number,' 'Text title,' and 'Text title' columns. Select your preferred color version (teal, pink, green, or purple) to match your presentation theme.
-
Recommended For
Recommended for finance, marketing, and sales teams presenting regular reports and performance updates. Effective for quarterly results reviews, product-by-product sales analysis, regional performance comparisons, and customer satisfaction survey results.
-
Slide Structure
Slides 1 and 2 each feature a horizontal bar chart with 5 items (0–90 scale) and a 3-row data table (Visual trends, Tremendous visual appeal, Top quality design, Contemporary colors). Bars use solid fill; table headers are color-coded (teal, pink, green, purple); decorative circular icons appear on the right side.
Related Products
-

Estimated Income Report Analysis Table – Financial Planning and Performance
#Financial Plans and Performance #Diagram #Capital Requirements
-

Visualizing Financial Planning and Performance with Table Charts
#Financial Plans and Performance #Diagram #Capital Requirements
-

Top Sales Analysis Graph – Visualizing Market and Performance
#Market and Competitor Analysis #Financial Plans and Performance #Diagram
-

Diagram Slide for Funding Plans and Sales Statements
#Financial Plans and Performance #Diagram #Capital Requirements
