Notebook Configuration Analysis Graph – The Optimal Choice for Organizing Data
RJ0300045_23
- Last Update 04/30/2025
- File Size 0.8MB
- # of Slides 2
- File Format PPTX
- Slide Ratio 16:9
- Color
Keywords
- #Content-Based Slides
- #Design-Based Slides
- #Product/Service Introduction
- #Graph
- #Composition
- #Development Plan
- #Horizontal Bar
- #Horizontal Bar Chart
- #16:9
- #horizontal bar chart PowerPoint
- #data comparison slide template
- #product analysis graph
- #performance metrics visualization
- #how to create bar chart in PowerPoint
About the Product
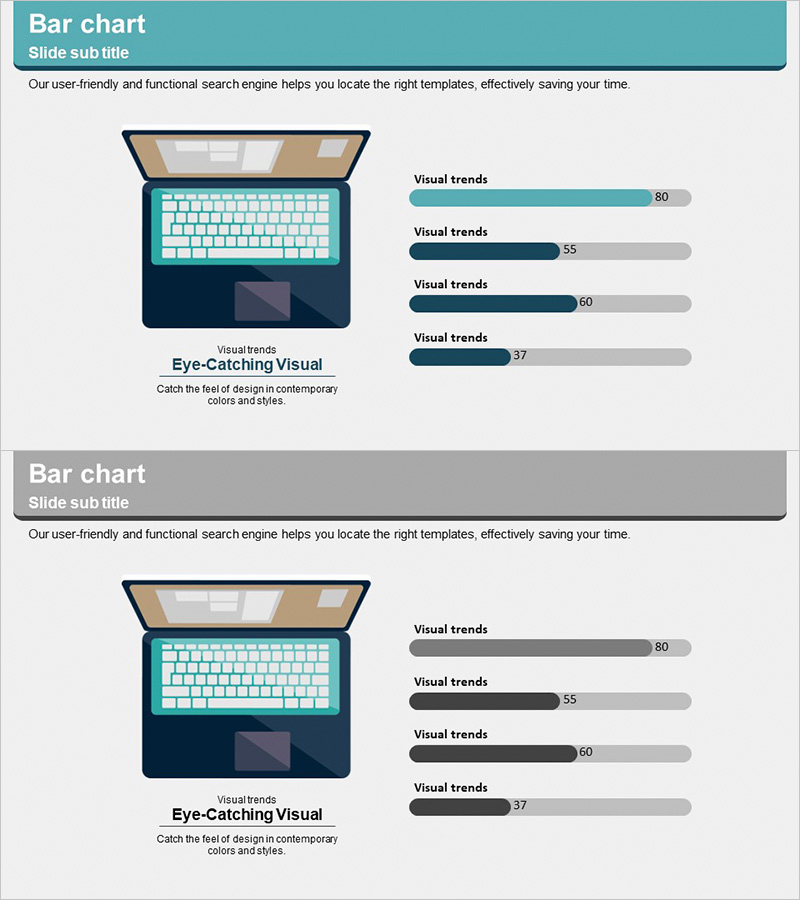
A horizontal bar chart PowerPoint slide designed to visualize notebook configuration and performance metrics across four key dimensions. The slide features a teal, navy, and charcoal color gradient that enables clear numerical comparison, paired with a laptop mockup illustration on the left to enhance credibility in product analysis presentations. The 2-slide set provides a consistent layout template with variations, allowing you to present multiple data sets in a unified visual style. Ideal for technical specifications, product comparisons, and performance analysis decks that require immediate deployment.
Usage Points
-
Main Usage
Presents product specifications, performance indicators, and technical metrics through numerical comparison. The horizontal bar format allows viewers to instantly grasp differences between notebook components or competing products, making complex technical data accessible and persuasive.
-
How to Use
Place product imagery or icons in the left notebook mockup area, then input actual performance data into the right bar chart. Use bar length and color gradients to emphasize item differences, with numerical labels displaying precise values. Leverage both slides to present sequential product comparisons or multiple data categories.
-
Recommended For
IT and electronics product launch presentations, technical specification comparison reports, performance benchmark analyses, product marketing materials, technical sales proposals, product development meetings, and competitive analysis decks.
-
Slide Structure
2-slide template. Each slide combines a left-side 3D laptop mockup illustration with a right-side horizontal bar chart displaying 4 data items in teal, navy, and charcoal gradient colors. Numerical value labels appear at the bar endpoints. Background features light gray with teal header section for visual hierarchy.
Related Products
-

Types and Characteristics of Coffee Beans – Visual Infographic Slide
#Product/Service Introduction #Diagram #Composition
-

Analysis Table of Our Mobile App Configuration – Simple Data Visualization
#Product/Service Introduction #Diagram #Other
-

Performance Metrics Dashboard Slide for Presentation Results
#Product/Service Introduction #Graph #Composition
-

Stylish Slide Design for Partnership Business Core Plans
#Product/Service Introduction #Operational Plan #Technical Approach
