Quality Management of Health Fitness Expert Programs Slide Template
RM0200019_12
- Last Update 02/06/2025
- File Size 0.3MB
- # of Slides 2
- File Format PPTX
- Slide Ratio 16:9
- Color
Keywords
- #Content-Based Slides
- #Design-Based Slides
- #Business Management
- #Operational Plan
- #Diagram
- #Graph
- #Quality Assurance Plan
- #Risk Management
- #Table
- #Circles
- #Standard Table
- #Doughnut Chart
- #16:9
- #donut chart PowerPoint slide
- #pie chart template
- #ratio visualization diagram
- #quality management graph PPT
- #business performance slide template
About the Product
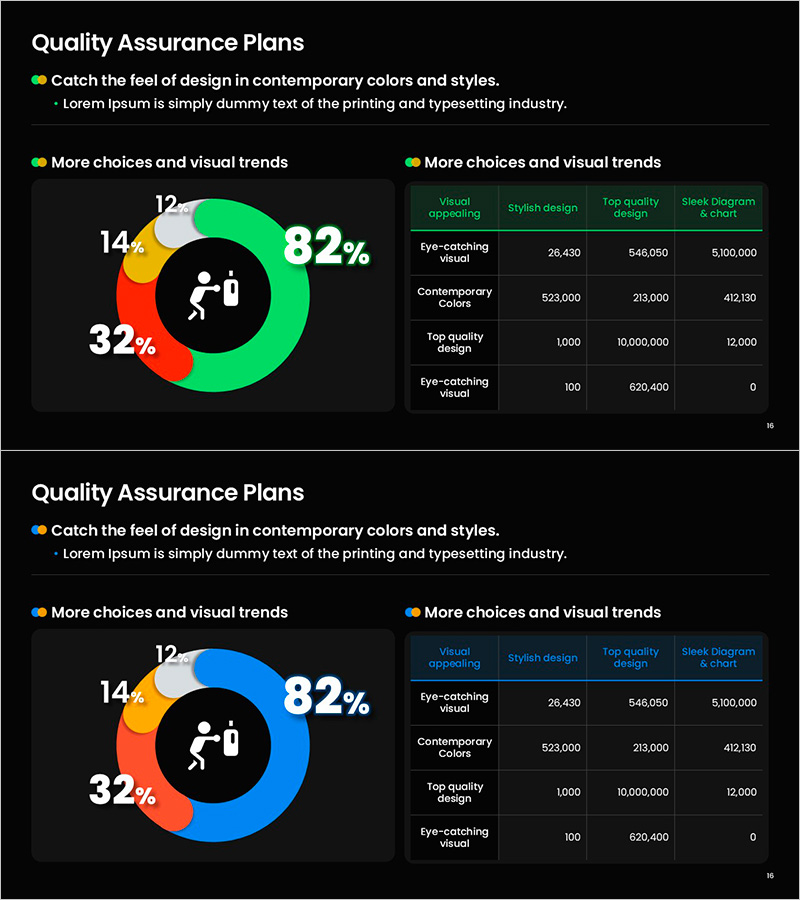
A donut chart PowerPoint slide template designed to visualize quality management and business performance metrics. Set against a black background, the design features a four-segment donut pie chart in green, orange, and gray tones with a central icon for emphasis. An accompanying data table on the right presents quantitative information clearly and professionally. Ideal for fitness expert programs, quality assurance presentations, and operational planning reports. The 2-slide set supports multiple ratio datasets, formatted in 16:9 widescreen for modern presentation environments.
Usage Points
-
Main Usage
Visualize quality assurance metrics, business performance, and operational composition ratios using a donut pie chart format to enhance audience comprehension. The central icon emphasizes key messages while the adjacent data table provides quantitative evidence.
-
How to Use
Apply this template to fitness program presentations, quality management reports, and business performance briefings by inputting your 4-category ratio data. Maintain the green, orange, and gray color scheme or customize with corporate brand colors for tailored presentations.
-
Recommended For
Ideal for fitness center managers, healthcare facility executives, marketing professionals, and training instructors presenting program quality indicators, customer satisfaction metrics, and operational efficiency data.
-
Slide Structure
2-slide set with each slide containing one 4-segment donut pie chart and one data table. The donut chart includes a central icon area for emphasis, while the table features a 5-row by 4-column layout for organized quantitative data presentation.
Related Products
-

Shareholder Status Survey Donut Graph – Optimized for Market Analysis
#Company Introduction #Market and Competitor Analysis #Diagram
-

Performance Analysis with Donut Chart and Table
#Market and Competitor Analysis #Diagram #Graph
-

Shareholder Status Analysis Donut Chart – Insights and Analysis
#Company Introduction #Market and Competitor Analysis #Diagram
-

Sensuous Doughnut Chart Slide – Market Share Analysis
#Market and Competitor Analysis #Diagram #Graph
