Infographic Design Wide Template Map&Table
RJ0200064_17
- Last Update 04/17/2025
- File Size 0.7MB
- # of Slides 2
- File Format PPTX
- Slide Ratio 16:9
- Color
Keywords
- #Content-Based Slides
- #Design-Based Slides
- #Market and Competitor Analysis
- #Financial Plans and Performance
- #Diagram
- #Other
- #Market Analysis
- #Sales and Revenue
- #Table
- #Standard Table
- #Map
- #16:9
- #Europe map PowerPoint
- #map slide template
- #location marker visualization
- #regional data map
- #geographic data PPT slide
- #world map presentation
About the Product
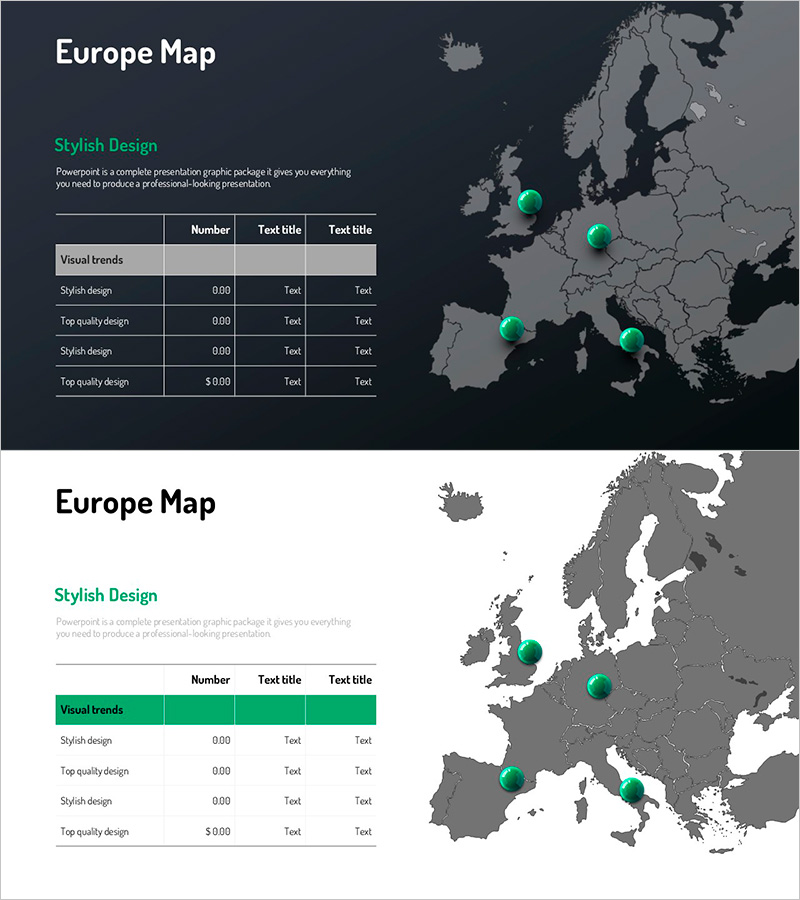
A 2-slide PowerPoint presentation combining a detailed Europe map with an integrated data table. Dark gray background with five green circular location markers positioned across key European regions for intuitive geographic data representation. The upper table displays rows for visual trends, stylish design, and quality metrics with editable text fields. Right side of the map includes space for additional annotations. Delivered in 16:9 widescreen PPTX format, ready for global market analysis, regional business status reports, international network presentations, and location-based communications. Fully editable slides, presentation graphics, and slide deck templates support professional geographic data storytelling.
Usage Points
-
Main Usage
Communicate geographic data for global market analysis, regional business status, international network expansion, and location-based positioning. The dark background with green marker contrast emphasizes key locations, while the table-map combination enables simultaneous presentation of quantitative and qualitative regional information.
-
How to Use
Click and drag the five location markers to reposition them according to your business offices, regional headquarters, or sales territories. Edit table rows and columns to input region-specific metrics such as revenue, customer count, growth rate, or market share. Customize background and marker colors to match corporate branding guidelines.
-
Recommended For
Ideal for global business reports, investor presentations, regional expansion strategy briefings, international marketing plans, and overseas office introductions. Suitable for executives, sales teams, marketing departments, and consultants requiring geographic data analysis and regional performance visualization.
-
Slide Structure
Slide 1: Dark gray background with grayscale Europe map and five green circular markers, left-aligned data table (5 rows × 4 columns). Slide 2: Light background variant with identical map layout for contrast options. All elements are individually editable shapes supporting custom modifications.
Related Products
-

Business Forest Wide Template Europe Map – A New Horizon for Market Analysis
#Market and Competitor Analysis #Financial Plans and Performance #Diagram
-

Sensuous Cloud Presentation Template with World Map
#Market and Competitor Analysis #Diagram #Other
-

Automobile Market Export Volume Visualization Slide – Market Analysis and Strategy
#Market and Competitor Analysis #Marketing Plan and Strategy #Diagram
-

America Map and Icon Sign – Effective Tool for Market Analysis
#Market and Competitor Analysis #Financial Plans and Performance #Diagram
