Yearly Plan Arrow Diagram – Quality Assurance Plans
RM0200015_26
- Last Update 02/05/2025
- File Size 0.8MB
- # of Slides 2
- File Format PPTX
- Slide Ratio 16:9
- Color
Keywords
- #Content-Based Slides
- #Design-Based Slides
- #Company Introduction
- #Business Management
- #Diagram
- #History
- #Quality Assurance Plan
- #Flow
- #Cluster
- #Linear Flow
- #Closed Cluster Diagram
- #16:9
- #yearly plan diagram PowerPoint
- #arrow flow diagram template
- #4-stage timeline slide
- #quality assurance plan presentation
- #business roadmap visualization PowerPoint
About the Product
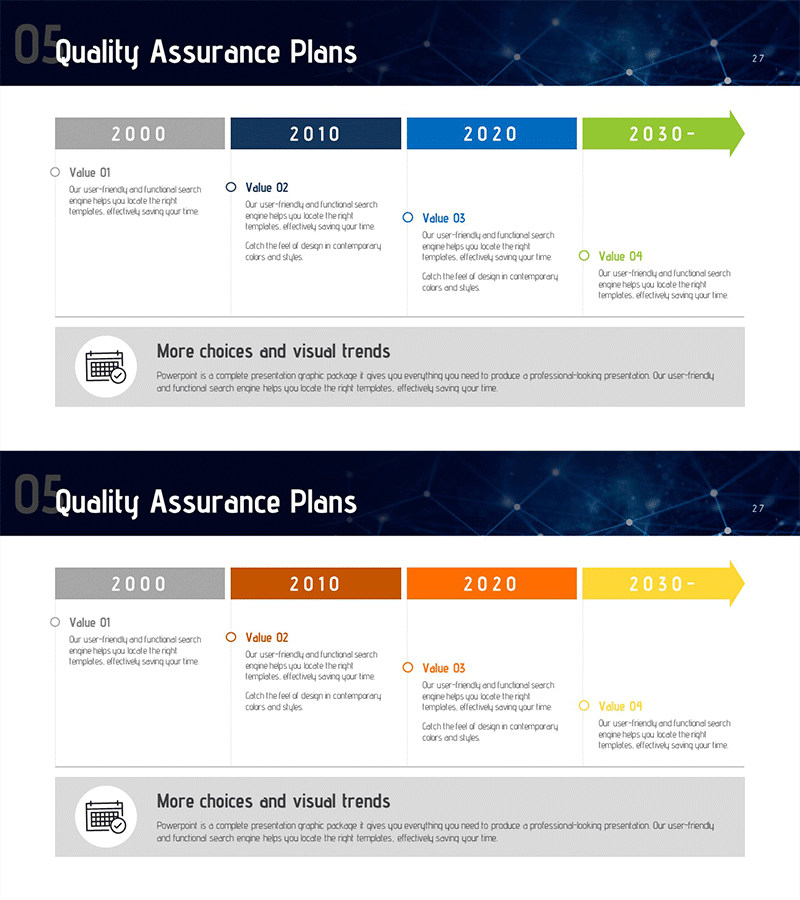
A PowerPoint slide that visualizes multi-year business plans using a 4-stage arrow flow diagram. This presentation template spans from 2000 to 2030 and beyond, with each time period clearly marked and dedicated space for key values and milestones. The design uses four distinct colors—gray, orange, blue, and yellow—to represent the progression of time and strategic phases. Each stage includes a value input area for core objectives, achievements, or strategic initiatives. The lower section features a 'More choices and visual trends' callout with calendar icon, providing space for supplementary information. Ideal for quality assurance planning, business management, and strategic roadmap presentations.
Usage Points
-
Main Usage
Communicates long-term business strategies by breaking down plans into distinct yearly phases. Each arrow stage accommodates key values, milestones, or strategic objectives, enabling clear visualization of organizational direction and progress over extended timeframes. Helps stakeholders understand sequential planning and phased execution.
-
How to Use
Enter year ranges (2000, 2010, 2020, 2030+) in each arrow box and populate the Value 01–04 sections with corresponding goals, achievements, or strategic initiatives. The color-coded arrows emphasize temporal progression. Use in quality assurance plans, business management reviews, strategic planning sessions, and executive presentations.
-
Recommended For
Executives, business planners, quality assurance managers, and strategy teams presenting multi-year initiatives. Suitable for business plans, management reports, investor presentations, organizational strategy briefings, quality improvement roadmaps, and any context requiring phase-by-phase timeline visualization.
-
Slide Structure
2-slide deck. Slide 1: Four arrow boxes representing time periods (2000/2010/2020/2030+) with Value 01–04 text input areas below each. Slide 2: Identical layout with alternate color scheme (orange and yellow tones). 16:9 widescreen format, fully editable PPTX with all elements customizable.
Related Products
-

Company History Introduction Slide – Flow and Cluster
#Company Introduction #Diagram #History
-

Customer Value and Offered Benefits – Step-by-Step Guide
#Business Strategy #Business Management #Diagram
-

Business Promotion Schedule Diagram – A Stepwise Approach to Success
#Company Introduction #Operational Plan #Diagram
-

Molecular Graphics History – Business Vision and Goals
#Company Introduction #Business Vision and Strategy #Diagram
