Future Technology System Configuration Diagram – Efficient Development Flow
RM0200015_20
- Last Update 02/05/2025
- File Size 0.8MB
- # of Slides 2
- File Format PPTX
- Slide Ratio 16:9
- Color
Keywords
- #Content-Based Slides
- #Design-Based Slides
- #Business Management
- #Technical Approach
- #Diagram
- #Service Development Plan
- #System Architecture Diagram
- #Flow
- #Circular Flow
- #16:9
- #circular diagram PowerPoint
- #system configuration slide
- #3-stage flow diagram
- #technology system diagram
- #process flow PowerPoint slide template
About the Product
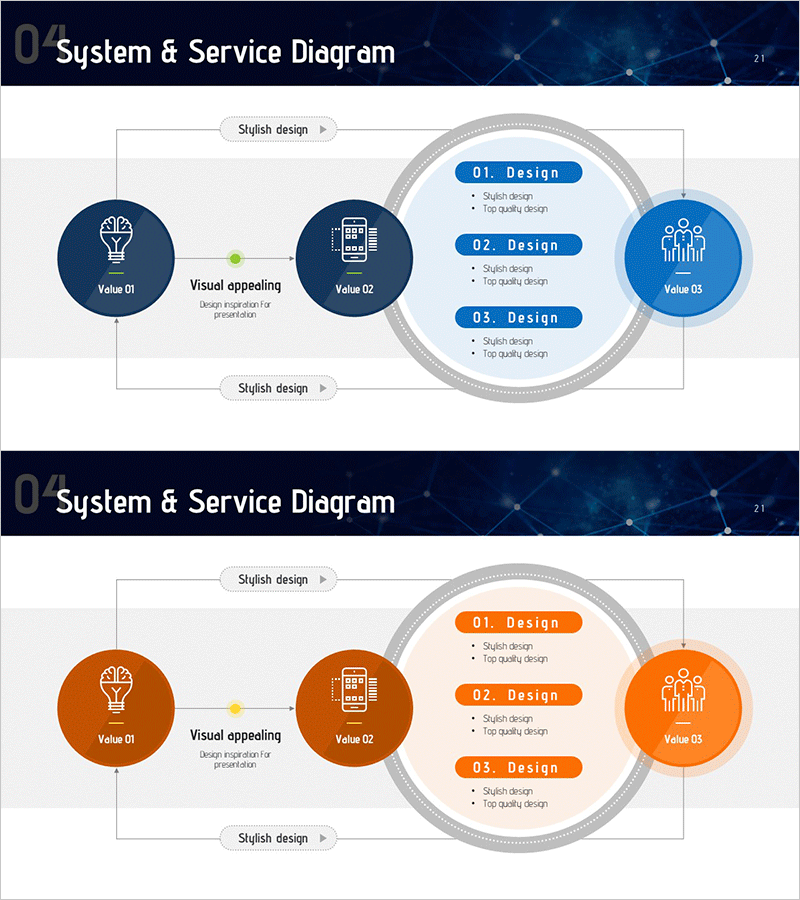
A 3-node circular diagram PowerPoint slide that visualizes future technology system configuration and development flow. The design flows from left Value 01 through central Value 02 to right Value 03, with a circular layout on the right displaying three design phases. Dark blue, light blue, and gray tones convey technical credibility, while icons and text labels clarify each stage's role. The 2-slide set includes color variations (dark blue and orange) for flexible presentation contexts.
Usage Points
-
Main Usage
This diagram presents technology system components and stage-by-stage design processes at a glance. Use it in technology, IT solution, and development process presentations to clearly communicate system architecture and each stage's function.
-
How to Use
Replace the three left nodes with your key value elements and the right circular area with detailed design items. Customize text labels and icons to match your system structure. Insert into the system configuration section of technology presentations, business plans, or product introductions.
-
Recommended For
IT and technology professionals, system architects, product development teams, and technical sales representatives explaining system configuration, development processes, or technology roadmaps. Ideal for startup pitches, technical seminars, and internal technology meetings where complex systems need simple visual representation.
-
Slide Structure
Slide 1: Dark blue tone – three circular nodes on left (with icons and labels), center connecting lines, right gray circular area with three blue boxes (01·02·03 Design). Slide 2: Orange tone – identical structure with color variation. 16:9 aspect ratio, 2-slide PPTX format.
Related Products
-

Business Services Organization Chart – Efficient Service Delivery Structure
#Business Management #Technical Approach #Diagram
-

Service Development Plan Strengths & Weaknesses
#Business Management #Technical Approach #Diagram
-

Financial Services System Diagram - Innovative Service Development
#Business Management #Technical Approach #Diagram
-

System Service Development Plan – Circular Diagram
#Technical Approach #Diagram #Service Development Plan
