Consumer Analysis Donut & Mixed Chart – Insights into Customers
RM0200015_15
- Last Update 02/05/2025
- File Size 0.9MB
- # of Slides 2
- File Format PPTX
- Slide Ratio 16:9
- Color
Keywords
- #Content-Based Slides
- #Design-Based Slides
- #Business Introduction
- #Market and Competitor Analysis
- #Graph
- #Other
- #Technological Status
- #Customer Analysis
- #Circles
- #Doughnut Chart
- #16:9
- #donut chart PowerPoint
- #pie chart slide template
- #mixed chart presentation
- #consumer analysis PPT
- #customer segmentation slides
About the Product
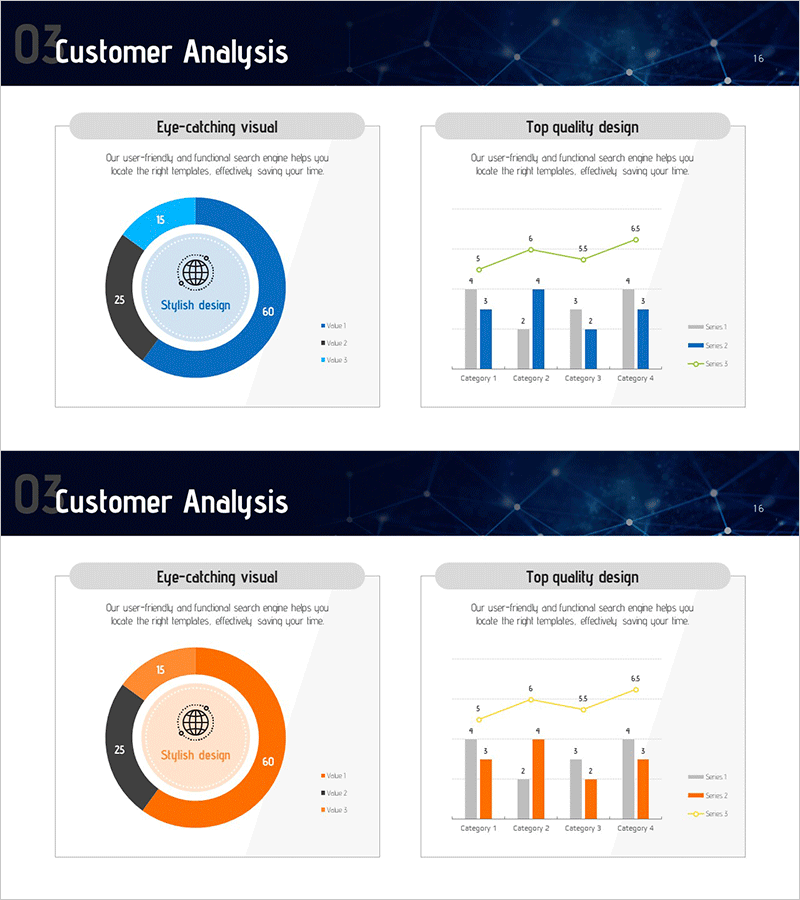
A 2-slide PowerPoint set featuring donut and mixed charts for consumer analysis visualization. The first slide displays a donut chart with a globe icon in the center, representing three data series in proportional segments. The second slide combines a clustered bar chart with a line graph overlay, comparing four categories across multiple metrics. Both slides are fully editable in PowerPoint, making them ideal for customer segmentation reports, market analysis presentations, and marketing performance reviews.
Usage Points
-
Main Usage
Visualize consumer analysis and customer segmentation data with clarity and impact. The donut chart effectively shows compositional proportions, while the mixed chart simultaneously displays trends and comparisons across multiple indicators, enabling data-driven decision-making.
-
How to Use
Insert into marketing reports, market analysis presentations, and customer insight decks as your data visualization section. Use PowerPoint's built-in chart editing tools to input your actual data; the chart automatically updates. Customize colors and legends to match your corporate branding guidelines.
-
Recommended For
Marketing professionals, business analysts, sales managers, and executives presenting customer analysis results, market segmentation findings, and sales performance comparisons. Particularly suited for strategy meetings and executive briefings requiring quantitative data visualization.
-
Slide Structure
Slide 1: Central globe icon + 3-series donut chart (blue, black, gray segments) + legend. Slide 2: 4-category clustered bar chart (blue, gray bars) + line graph overlay (green) + legend + data labels. 16:9 widescreen format, 2-slide composition.
Related Products
-

Silhouette Diagram & Circle Donut Graph – Visual Tool for Customer Analysis
#Product/Service Introduction #Market and Competitor Analysis #Graph
-

Internet of Things User Analysis Status – Customer Insights and Data Visualization
#Product/Service Introduction #Market and Competitor Analysis #Graph
-

User Analysis Graph by Year – Insights into Customer Behavior
#Market and Competitor Analysis #Graph #Other
-

User Analysis Donut Chart – Optimal for Market and Competitor Analysis
#Market and Competitor Analysis #Graph #Other
