Business Strategy Analysis with Line Chart
RJ0900019_8
- Last Update 08/21/2025
- File Size 0.3MB
- # of Slides 2
- File Format PPTX
- Slide Ratio 16:9
- Color
Keywords
- #Content-Based Slides
- #Design-Based Slides
- #Business Strategy
- #Market and Competitor Analysis
- #Diagram
- #Graph
- #Financial Outlook & Expected Impact
- #Future Outlook
- #Table
- #Line
- #Standard Table
- #Line Chart
- #16:9
- #line chart PowerPoint
- #multi-series chart template
- #trend analysis slide
- #business strategy presentation
- #time series data visualization
- #PowerPoint graph slide download
About the Product
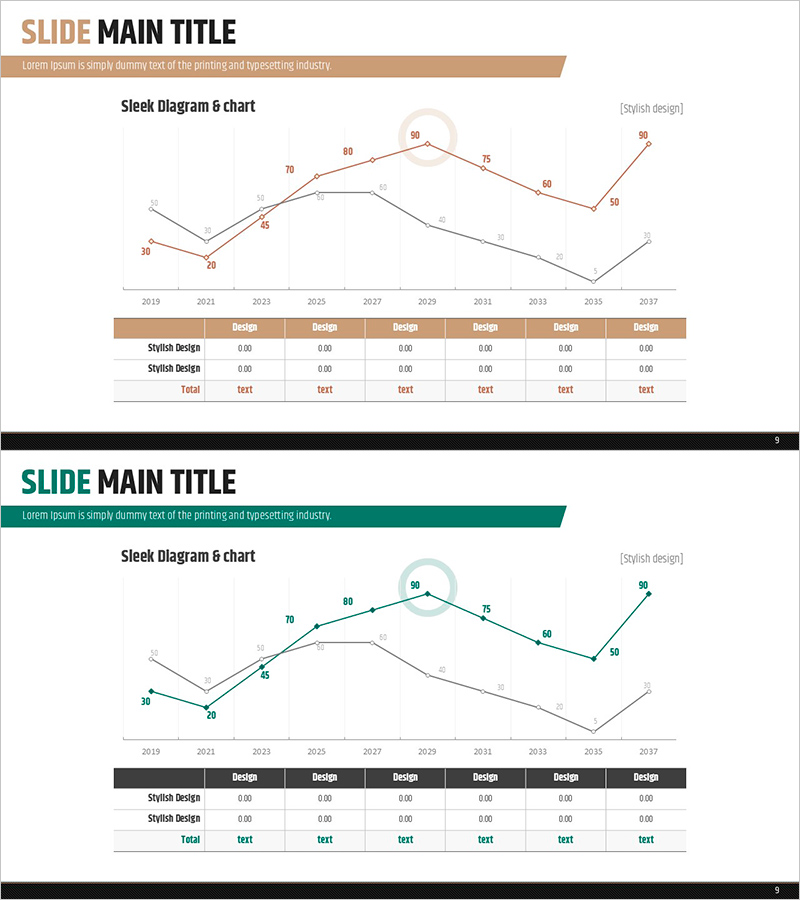
A multi-series line chart PowerPoint slide optimized for business strategy analysis and market trend comparison. This presentation template visualizes long-term data spanning 2019 to 2037 across three data series, with beige and teal accent lines highlighting key metrics. The accompanying data table at the bottom reinforces numerical accuracy and credibility for executive presentations. Delivered as a fully editable PPTX file in 16:9 widescreen format with 2 slides.
Usage Points
-
Main Usage
Visualize long-term business performance, market trends, and competitive benchmarking data using multi-series line charts to reveal trend patterns and relative positioning at a glance. Effectively communicates quantitative analysis results with high credibility for executive and investor audiences.
-
How to Use
Replace the line chart data series and numerical values with your own metrics. The color-coded series (beige, teal, and gray) clearly distinguish each data set, while the data table below allows you to input precise figures for enhanced presentation credibility.
-
Recommended For
Business strategy planning and review meetings, market analysis reports, executive briefings, investor pitch decks (IR materials), quarterly and annual performance reviews, competitive benchmarking analysis, and any business presentation requiring quantitative trend comparison.
-
Slide Structure
2-slide template. Each slide features a multi-series line chart with 3 data series across 19 data points (2019–2037) and an information table below. Beige header bar and teal accent lines establish visual hierarchy. Optimized for 16:9 widescreen format with fully editable elements.
Related Products
-

Technology Service Future Outlook and Expected Effect Graph – A Visual Tool for Business Strategy
#Business Strategy #Market and Competitor Analysis #Graph
-

Future Outlook and Expected Effects Graph – Harmony of Blue and Orange
#Business Strategy #Market and Competitor Analysis #Graph
-

Visualizing Future Outlook and Expected Effects – Harmony of Green and Orange
#Business Strategy #Market and Competitor Analysis #Graph
-

Analysis of Sales Growth Segments Slide
#Technical Approach #Market and Competitor Analysis #Diagram
