Photo Business Market Analysis - Insights through Data Visualization
RM0200014_6
- Last Update 02/05/2025
- File Size 1MB
- # of Slides 2
- File Format PPTX
- Slide Ratio 16:9
- Color
Keywords
- #Content-Based Slides
- #Design-Based Slides
- #Company Introduction
- #Business Introduction
- #Diagram
- #Graph
- #Key Achievements
- #Business Areas
- #Table
- #Line
- #Standard Table
- #Line Chart
- #16:9
- #line chart PowerPoint
- #multi-series chart slide
- #trend analysis presentation
- #data visualization PPT
- #business performance graph
About the Product
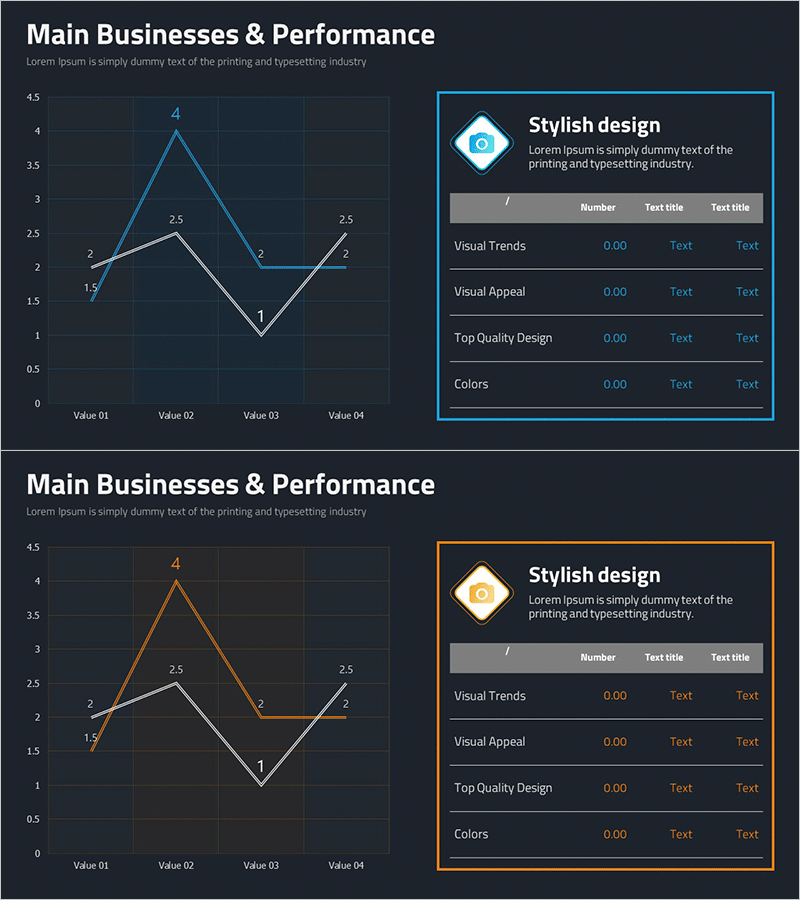
A PowerPoint slide that compares business performance and market trends using four data series displayed as line charts. The design features a dark background with blue, orange, and white lines that clearly visualize data changes and trends. Each data point includes numerical labels for precise value comparison, while the information box on the right summarizes key metrics. This presentation slide is ready to use for market analysis, performance reports, and business insight presentations.
Usage Points
-
Main Usage
Compare multiple data series over time to analyze trends, business performance, market dynamics, and competitive positioning. Designed to help audiences understand complex multi-variable data at a glance.
-
How to Use
Input actual data into the left-side line chart and enter key metric names and values in the right-side information box. Adjust line colors to emphasize different series, and modify legend and axis labels to match your presentation context.
-
Recommended For
Marketing professionals, executives, and analysts presenting quarterly results, market research findings, and competitive analysis. Ideal for business plans, investor pitch decks, and performance reports requiring multi-metric comparison.
-
Slide Structure
Left side features a 4-series line chart with Value 01-04 (2-4 data points each); right side includes a diamond icon with a 4-row information table (Visual Trends, Visual Appeal, Top Quality Design, Colors).
Related Products
-

Key Revenue Analysis Chart by Year – A Snapshot of Business Performance
#Company Introduction #Business Introduction #Diagram
-

Key Performance Analysis Graph – The Power of Data Visualization
#Company Introduction #Market and Competitor Analysis #Diagram
-

Main Business and Performance Analysis Graph – Insights Based on Data
#Company Introduction #Business Introduction #Graph
-

Analysis Table of Main Business Areas – The Power of Visual Data
#Company Introduction #Business Introduction #Diagram
