Analysis Table of Main Business Areas – The Power of Visual Data
RM0200009_6
- Last Update 02/03/2025
- File Size 0.6MB
- # of Slides 2
- File Format PPTX
- Slide Ratio 16:9
- Color
Keywords
- #Content-Based Slides
- #Design-Based Slides
- #Company Introduction
- #Business Introduction
- #Diagram
- #Key Achievements
- #Business Areas
- #Cluster
- #Table
- #Chain Diagram
- #Standard Table
- #16:9
- #circular diagram PowerPoint
- #3-node cycle slide
- #business area analysis presentation
- #data table PPT slide
- #business diagram template
- #how to create circular diagram in PowerPoint
About the Product
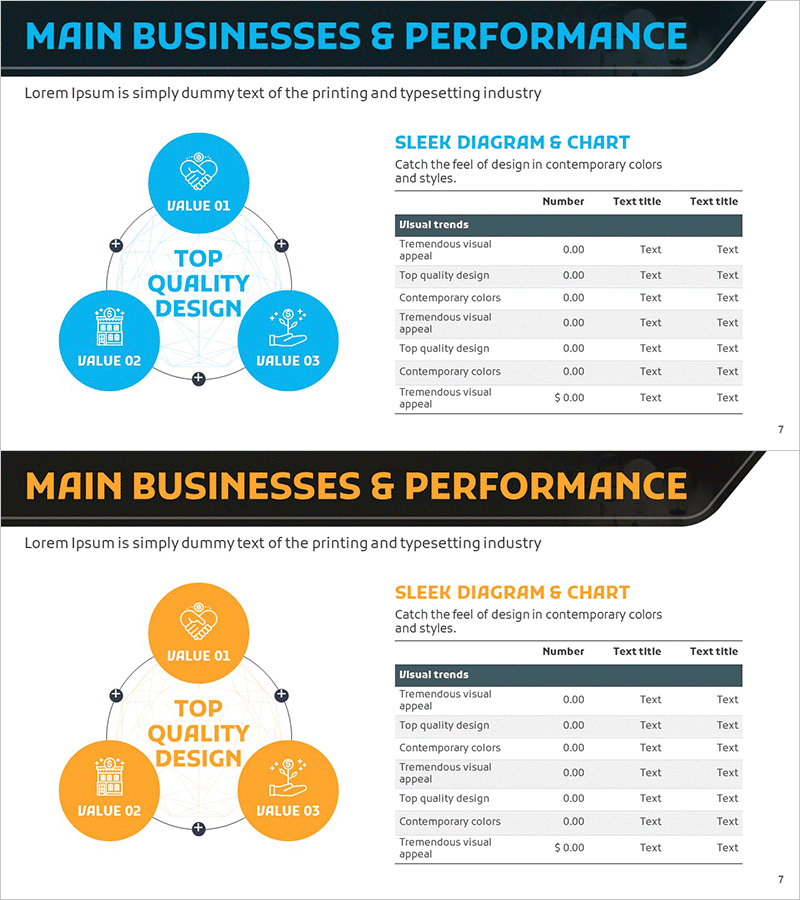
A PowerPoint slide that visualizes main business areas using a 3-node circular structure. The central message 'Top Quality Design' is surrounded by VALUE 01, 02, and 03 nodes arranged in a cycle, each with icon and text input fields. A data table is positioned on the right side, combining visual diagram representation with numerical information. This presentation slide is ready to use for business introductions, strategic analysis, organizational structure explanations, and various corporate presentation scenarios.
Usage Points
-
Main Usage
Visualize core business values and detailed areas through circular structure while presenting quantitative data in table format to enhance audience understanding. Effective for presentations requiring multi-layered information delivery such as strategy planning, business introduction, and organizational role explanation.
-
How to Use
Enter core message in the central circular node and fill three surrounding nodes with detailed items (VALUE 01-03). Input numerical values, metrics, and descriptions in the right table to link diagram with data. Colors and icons are fully editable to match corporate branding.
-
Recommended For
Business strategy planners, marketing professionals, executives preparing reports, and training instructors benefit from this slide when explaining business areas, organizational structures, and strategic directions. Particularly useful when conveying both qualitative messages and quantitative data simultaneously.
-
Slide Structure
Left side: 3-node circular diagram (1 central node + 3 surrounding nodes with connecting lines), right side: data table (8 rows × 3 columns). Diagram nodes include icon areas and text input fields. Table consists of header row (Visual trends) plus 7 data rows.
Related Products
-

Photo Business Market Analysis - Insights through Data Visualization
#Company Introduction #Business Introduction #Diagram
-

Key Revenue Analysis Chart by Year – A Snapshot of Business Performance
#Company Introduction #Business Introduction #Diagram
-

Marketing Strategy & Table of Contents – Cluster Design for Data Visualization
#Business Vision and Strategy #Marketing Plan and Strategy #Diagram
-

Subject Learning Elements Diagram – Visualizing Business Regions and Structure
#Product/Service Introduction #Business Introduction #Diagram
