Photography Status Analysis Chart – Bar Chart for Market and Competitive Analysis
RM0200014_26
- Last Update 02/05/2025
- File Size 1.6MB
- # of Slides 2
- File Format PPTX
- Slide Ratio 16:9
- Color
Keywords
- #Content-Based Slides
- #Design-Based Slides
- #Business Management
- #Market and Competitor Analysis
- #Graph
- #Quality Assurance Plan
- #Market Analysis
- #Horizontal Bar
- #Grouped Horizontal Bar
- #16:9
- #horizontal bar chart PowerPoint
- #bar graph slide template
- #comparative analysis chart
- #data visualization PPT
- #market analysis PowerPoint slide
About the Product
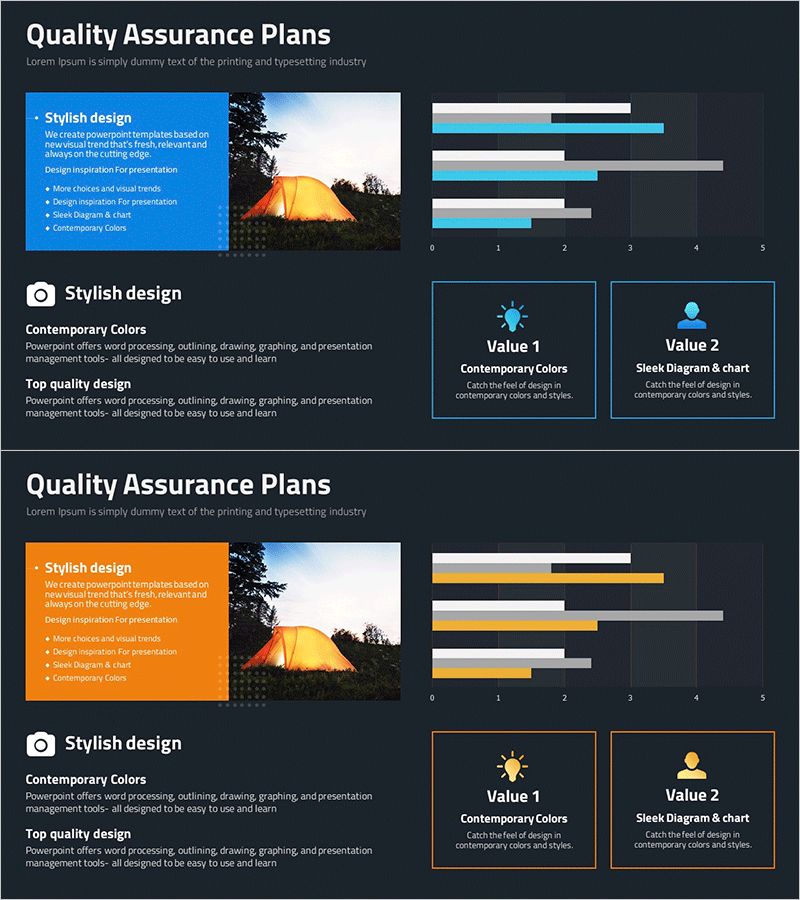
A horizontal bar chart PowerPoint slide designed for photography industry status analysis and competitive benchmarking. The slide features a dark background with blue and gray bar series comparing four key metrics side by side, enabling clear visualization of market size, competitive positioning, and growth rates. The 2-slide template includes the main chart on the first slide and an insights summary section on the second, optimized for 16:9 widescreen format. Ready to use in presentations, reports, and strategic planning documents with editable data fields.
Usage Points
-
Main Usage
This horizontal bar chart slide is optimized for comparing quantitative metrics across multiple categories and displaying ranked data. It effectively visualizes market share, revenue figures, performance metrics, and growth rates, making it ideal for competitive benchmarking, industry analysis, and performance reporting in business presentations.
-
How to Use
Double-click the chart to access the embedded Excel data sheet and input your values directly; bar lengths update automatically. Customize colors, fonts, and legend through PowerPoint's Design tab, or use Slide Master to apply corporate branding. Add entrance animations to bars for sequential reveal during presentations, enhancing audience engagement.
-
Recommended For
Ideal for marketing, sales, and strategy teams presenting market analysis, executive reports, investor pitch decks, consulting proposals, and industry research. Particularly suited for photography, media, and content industry analysis, competitive landscape evaluation, and data-driven performance communication.
-
Slide Structure
2-slide template featuring a horizontal bar chart on the first slide with four data series (dark background, blue/gray/white color palette) including legend and axis labels. The second slide provides space for chart interpretation and key insights with supporting icons and text areas, formatted for 16:9 widescreen display.
Related Products
-

Medical Record Analysis Bar Graph – Market and Competitor Analysis
#Market and Competitor Analysis #Graph #Competitor Analysis
-

Prepare for Market Analysis with Four Color Infographic Template
#Market and Competitor Analysis #Financial Plans and Performance #Graph
-

Visualizing Business Strategy with Bar Charts – Market Analysis and Future Outlook
#Market and Competitor Analysis #Diagram #Graph
-

Audio Icons and Comparison Graphs – A New Dimension in Market Analysis
#Market and Competitor Analysis #Graph #Market Analysis
