Audio Icons and Comparison Graphs – A New Dimension in Market Analysis
RJ0800026_27
- Last Update 08/07/2025
- File Size 0.4MB
- # of Slides 2
- File Format PPTX
- Slide Ratio 16:9
- Color
Keywords
- #Content-Based Slides
- #Design-Based Slides
- #Market and Competitor Analysis
- #Graph
- #Market Analysis
- #Competitive Advantage
- #Horizontal Bar
- #Grouped Horizontal Bar
- #16:9
- #horizontal bar chart PowerPoint
- #comparison graph slide template
- #market analysis presentation
- #competitive analysis chart
- #data comparison slide download
About the Product
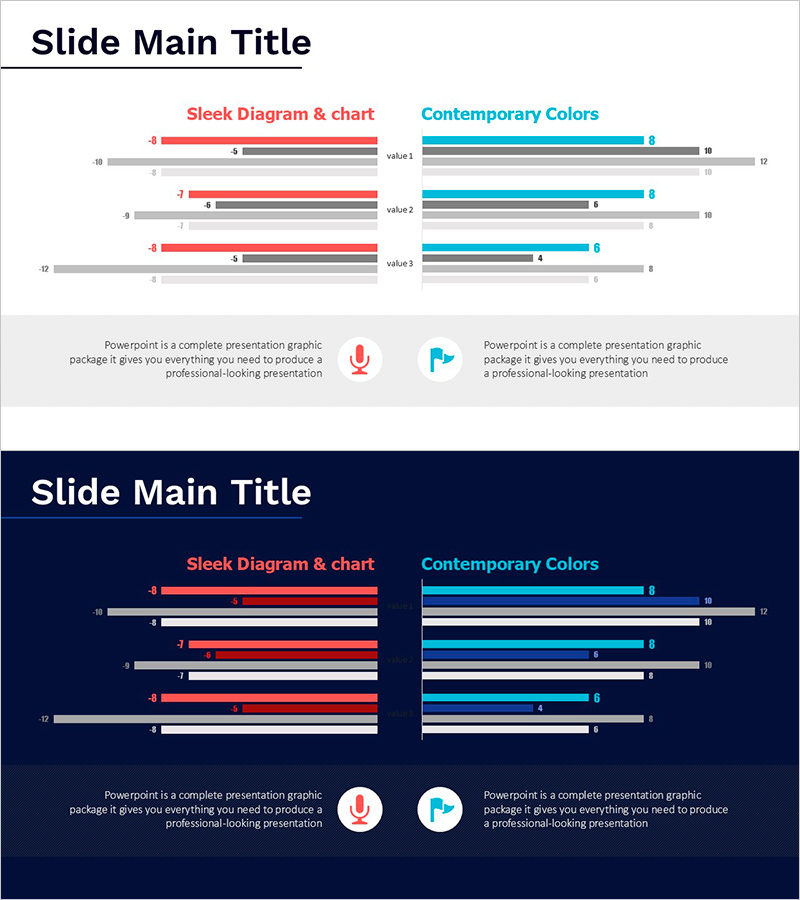
A horizontal bar comparison chart PowerPoint slide optimized for market analysis and competitive benchmarking. The design uses red and cyan dual-tone colors to create strong visual contrast across three data items, making numerical comparisons immediately clear. Each item displays 2–3 data series simultaneously, enabling complex multi-metric analysis in a single view. Audio icon elements serve as visual emphasis points to enhance presentation impact. The 2-slide set includes both light and dark background versions, ensuring compatibility with various presentation environments and lighting conditions.
Usage Points
-
Main Usage
Ideal for market analysis, competitive benchmarking, sales performance comparison, and departmental KPI reviews. The bold red-cyan color contrast captures audience attention while enabling simultaneous comparison of multiple data series. Perfect for presenting quantitative findings that require clear visual hierarchy.
-
How to Use
Bar length and color distinguish data magnitude and categories. Use the light version for bright conference rooms and the dark version for auditoriums or dimly lit spaces. Click the audio icon to add voice-over narration, or edit text labels to input your own data. All elements are fully editable in PowerPoint.
-
Recommended For
Marketing managers, sales directors, financial analysts, executive report writers, and consulting professionals. Especially suited for B2B presentations, quarterly performance reviews, market research findings, and competitive intelligence briefings.
-
Slide Structure
Slide 1 (light background): Title area + left red bars (3 items × 3 series) + right cyan bars (3 items × 3 series) + legend + audio icon. Slide 2 (dark background): identical layout on navy background with white text. All bars include numeric labels for precise data reference.
Related Products
-

Horizontal Bar Chart for Construction Project Performance Analysis – Stability and Growth
#Market and Competitor Analysis #Diagram #Graph
-

Travel Guide Market Analysis by State in the United States Using Horizontal Bar Chart
#Market and Competitor Analysis #Graph #Other
-

Market Analysis Graph by Year – Visualizing Competitive Advantage
#Market and Competitor Analysis #Graph #Market Analysis
-

Market Analysis by Year Visualization with Bar Charts
#Market and Competitor Analysis #Graph #Market Analysis
