Gradient Graph of Future Outlook Analysis – Market Growth and Expected Effects
RM0200013_11
- Last Update 02/04/2025
- File Size 0.3MB
- # of Slides 2
- File Format PPTX
- Slide Ratio 16:9
- Color
Keywords
- #Content-Based Slides
- #Design-Based Slides
- #Business Strategy
- #Market and Competitor Analysis
- #Graph
- #Financial Outlook & Expected Impact
- #Future Outlook
- #Column
- #Grouped Column
- #16:9
- #grouped bar chart PowerPoint slide
- #horizontal and vertical bar graph
- #year-over-year comparison
- #market growth analysis PPT
- #data visualization slide template
- #business forecast presentation
About the Product
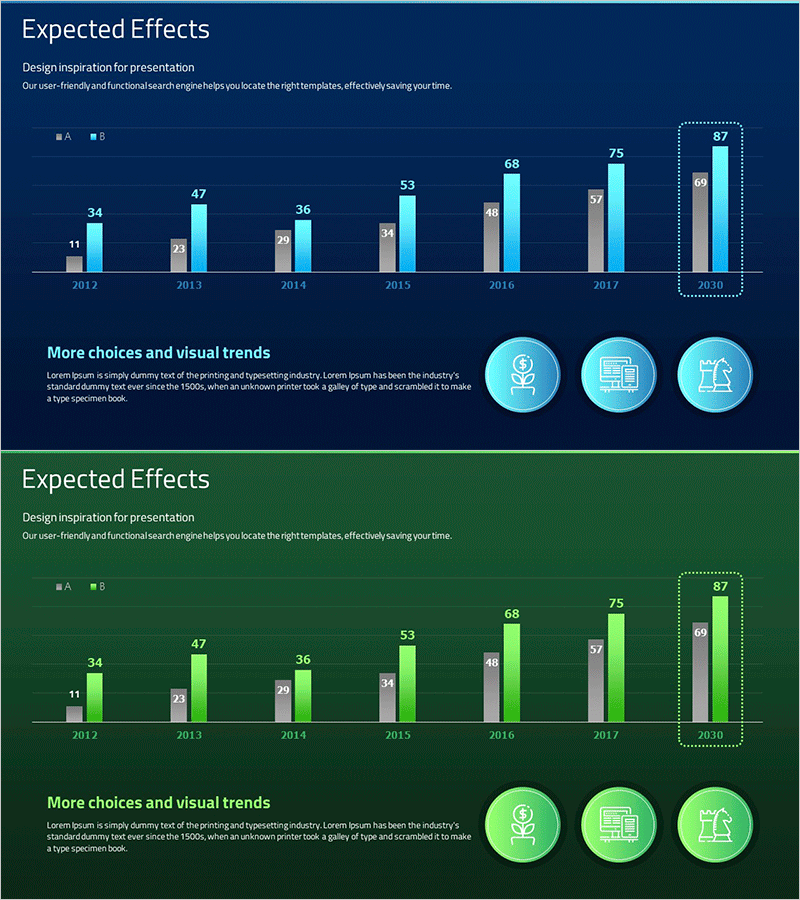
A PowerPoint slide deck visualizing market growth trends from 2012 to 2030 using grouped horizontal and vertical bar charts. Two color schemes—navy blue and green backgrounds—provide design flexibility for different presentation contexts. Each slide displays dual-series data (A and B) side by side for direct comparison, with year-by-year numerical values clearly labeled. Three circular icons at the bottom highlight key insights or expected outcomes. Ideal for business strategy presentations, market analysis reports, financial forecasts, and investment pitch decks where data-driven storytelling is essential.
Usage Points
-
Main Usage
Designed to compare time-series data across two categories—such as market growth rates, business performance metrics, revenue trends, or competitive benchmarks—across multiple years. The dual-series format enables side-by-side analysis, making growth patterns and performance gaps immediately visible to your audience.
-
How to Use
Slide 1 features a navy blue background; Slide 2 uses green. Replace the sample data values with your actual figures and update the legend labels (A and B) to match your categories. Customize the three circular icons at the bottom with key takeaways, strategic implications, or expected outcomes to reinforce your message.
-
Recommended For
Executive briefings, business plans, investor pitch decks, quarterly and annual performance reviews, market research reports, and marketing strategy presentations. Recommended for executives, business analysts, data analysts, marketing managers, and strategic planners who need to present comparative performance data.
-
Slide Structure
2-slide deck. Slide 1 (navy background): title area + grouped horizontal bar chart spanning 2012–2030 (11 data points) with dual series + 3 circular icons. Slide 2 (green background): identical layout with vertical bar chart variant. Both slides use 16:9 widescreen format, PPTX file type, fully editable elements.
Related Products
-

Profit Forecast and Progress Graph – Harmony of Blue and Orange
#Business Strategy #Graph #Financial Outlook & Expected Impact
-

Stereographic Area Graph for Data Analysis and Market Outlook
#Business Strategy #Market and Competitor Analysis #Graph
-

Future Outlook and Expected Effects Visualization – Graph Representing Business Strategic Plans
#Business Strategy #Market and Competitor Analysis #Graph
-

Cash Flow and Earnings Outlook Chart
#Business Introduction #Market and Competitor Analysis #Graph
