Competitive Market Positioning Analysis Slide
RM0200012_16
- Last Update 02/04/2025
- File Size 0.7MB
- # of Slides 2
- File Format PPTX
- Slide Ratio 16:9
- Color
Keywords
- #Content-Based Slides
- #Design-Based Slides
- #Market and Competitor Analysis
- #Marketing Plan and Strategy
- #Graph
- #Other
- #Market Analysis
- #Positioning
- #16:9
- #competitive positioning analysis PPT
- #market positioning PowerPoint slide
- #competitor comparison chart
- #marketing strategy positioning slide
- #how to create a positioning matrix in PowerPoint
About the Product
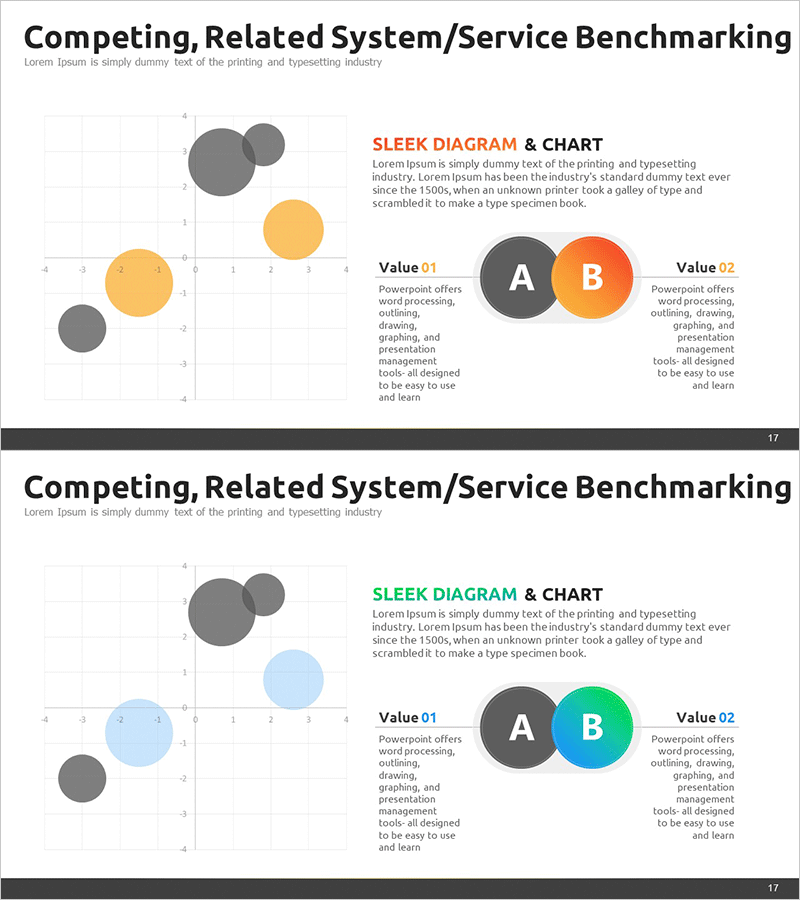
A PowerPoint slide designed to visually compare and analyze competitive market positioning. The layout features a scatter plot chart on the left and a two-axis comparison framework on the right, using gray, orange, and blue circular elements to intuitively represent competitive relationships. This presentation slide is immediately applicable for competitive advantage analysis, market entry strategy, and positioning decision-making during marketing strategy development. Provided in 16:9 widescreen PPTX format with user-friendly text and data input fields.
Usage Points
-
Main Usage
This slide supports data-driven analysis of your company's market positioning relative to competitors and facilitates strategic decision-making. The scatter plot chart reveals competitive distribution patterns, while the two-axis comparison layout clearly communicates core value propositions (Value A and B). It is used in marketing strategy development, new product launch planning, and investor presentations to substantiate competitive advantages.
-
How to Use
Input competitor data in the left scatter plot area to visualize market distribution, then populate the Value 01 and Value 02 sections on the right with your company's and competitors' key differentiators. Adjust the size and color of circular elements to visually emphasize market share or competitive strength. Modify scatter plot axis labels (price, quality, innovation, etc.) based on presentation context to apply the slide to various positioning analyses.
-
Recommended For
Recommended for marketing managers, strategy planning teams, new business development teams, and executive presentations. Particularly valuable for market entry strategy development, competitive analysis reports, market analysis sections in business plans, and investor pitch decks where competitive advantage must be substantiated with data. Ideal for consulting firms, startups, and corporate strategy teams presenting competitive analyses.
-
Slide Structure
Two-slide set with identical layout featuring a left scatter plot chart (4×4 grid with gray, orange, and blue circular elements) and right text area (SLEEK DIAGRAM & CHART title, descriptive text). The second slide applies color variation (blue emphasis) to the same framework. Each slide contains four input areas: title, scatter plot, Value comparison sections, and descriptive text.
Related Products
-

Positioning Point Area Graph – Strategy for Market Analysis
#Market and Competitor Analysis #Marketing Plan and Strategy #Diagram
-

Positioning Market Analysis Chart – Understanding Markets and Strategies
#Market and Competitor Analysis #Marketing Plan and Strategy #Diagram
-

Positioning Image Map Graph – Effective Visualization for Market Analysis
#Market and Competitor Analysis #Marketing Plan and Strategy #Graph
-

Competitor Positioning Graph – Diagram for Market Analysis
#Market and Competitor Analysis #Marketing Plan and Strategy #Diagram
