Strategic Positioning Map – Market Analysis and Marketing Strategy
RM0100007_25
- Last Update 01/26/2025
- File Size 0.4MB
- # of Slides 2
- File Format PPTX
- Slide Ratio 16:9
- Color
Keywords
- #Content-Based Slides
- #Design-Based Slides
- #Market and Competitor Analysis
- #Marketing Plan and Strategy
- #Diagram
- #Graph
- #Other
- #Market Analysis
- #Positioning
- #Table
- #16:9
- #positioning map PowerPoint slide
- #market analysis two-quadrant chart
- #competitive positioning bubble chart
- #marketing strategy PowerPoint template
- #how to create a positioning map in PowerPoint
About the Product
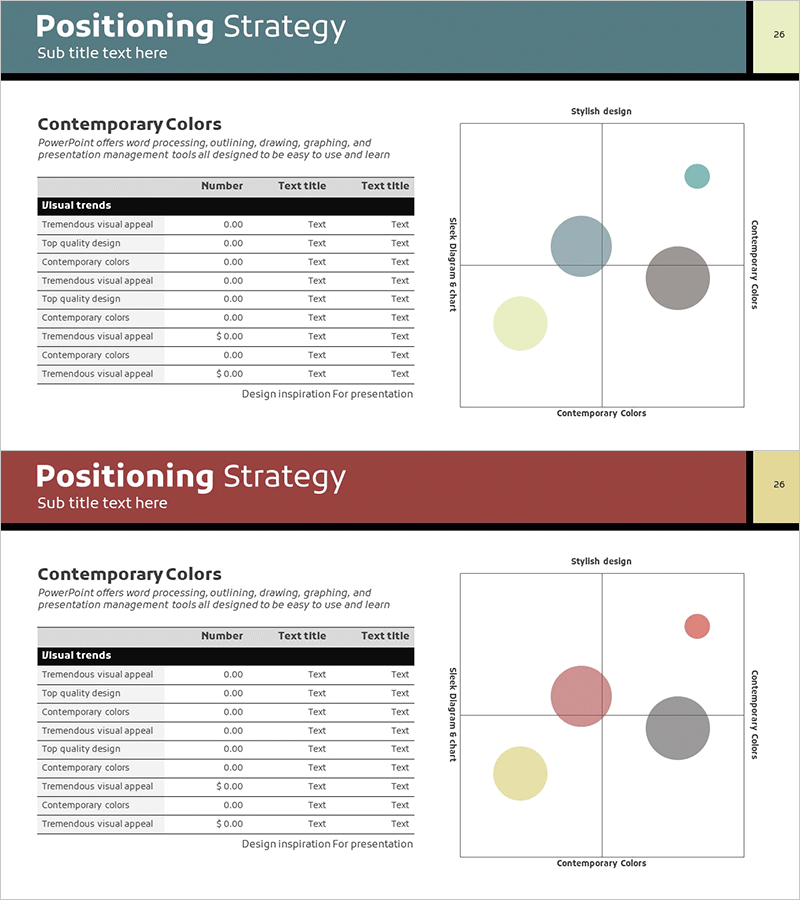
A professional positioning map PowerPoint slide designed for market analysis and marketing strategy presentations. This 2-slide set features a teal-gray and wine-red color scheme with beige accents and white backgrounds. The left side displays a visual trends table with multiple rows for competitive data entry, while the right side shows a two-quadrant coordinate system with bubble chart elements of varying sizes. The layout enables clear visualization of competitive positioning, product differentiation, and market share comparison. Delivered in 16:9 widescreen PPTX format with fully editable elements, perfect for marketing strategy decks, investor pitches, and competitive analysis presentations.
Usage Points
-
Main Usage
Visually represent your product or service position within a competitive market landscape and clearly communicate differentiation points against competitors. The bubble chart with variable sizing illustrates market share and competitive dynamics to support strategic decision-making.
-
How to Use
Insert into the market analysis section of marketing strategy decks, investor presentations, or competitive analysis reports. Populate the left table with competitor names and product details, then adjust bubble positions and sizes on the right chart to reflect actual market data. Customize colors to match your brand guidelines.
-
Recommended For
Marketing managers, strategy planners, sales executives, and investor relations teams presenting market positioning and competitive strategy. Particularly effective for new product launches, market entry strategies, and repositioning announcements.
-
Slide Structure
Two-slide set with identical layout in different color schemes. Each slide contains a header section with title, a left-side table (10 rows × 3 columns) for competitive data, and a right-side two-quadrant coordinate system with three bubble elements. All text boxes, shapes, and chart elements are fully editable and resizable.
Related Products
-

Market Distribution Analysis Positioning Map – Strengthening Competitiveness
#Market and Competitor Analysis #Marketing Plan and Strategy #Diagram
-

Artificial Intelligence Development Market Positioning Map – Effective Visual Data Comparison
#Market and Competitor Analysis #Marketing Plan and Strategy #Diagram
-

Positioning Analysis Chart – Market Competitiveness Strategy
#Market and Competitor Analysis #Marketing Plan and Strategy #Diagram
-

Positioning Point Area Graph – Strategy for Market Analysis
#Market and Competitor Analysis #Marketing Plan and Strategy #Diagram
