Positioning Strategy Circle Graph
RM0100010_25
- Last Update 01/27/2025
- File Size 0.9MB
- # of Slides 2
- File Format PPTX
- Slide Ratio 16:9
- Color
Keywords
- #Content-Based Slides
- #Design-Based Slides
- #Market and Competitor Analysis
- #Marketing Plan and Strategy
- #Graph
- #Other
- #Market Analysis
- #Positioning
- #16:9
- #positioning strategy PPT slide
- #market analysis PowerPoint
- #competitive analysis circle graph
- #positioning matrix template
- #marketing strategy slide
About the Product
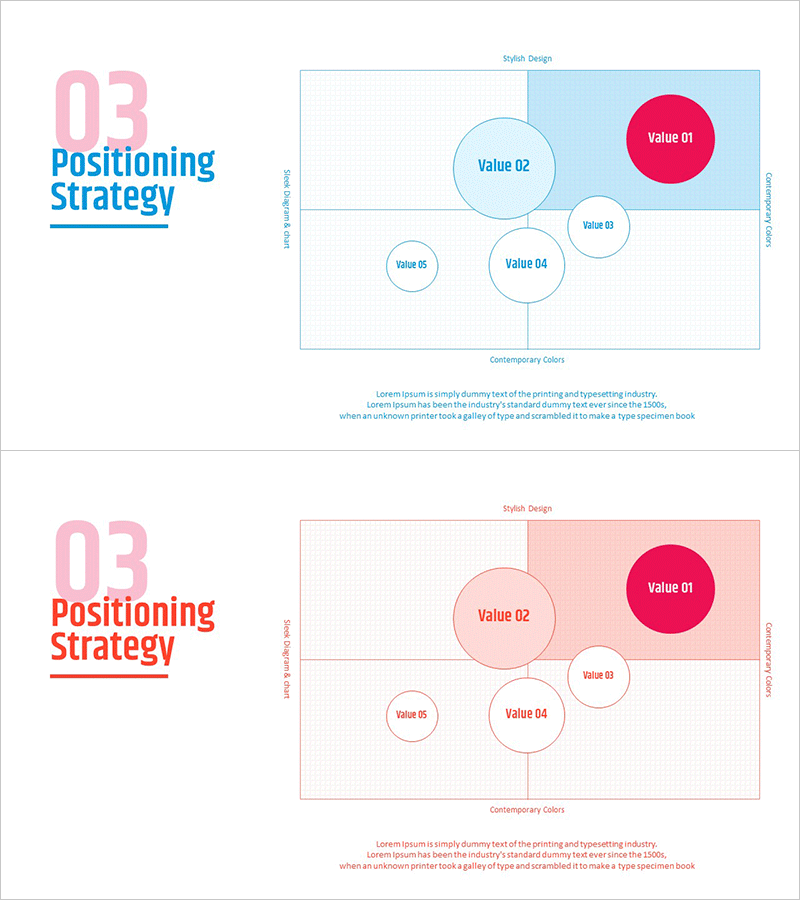
A 2-slide PowerPoint presentation template for visualizing market positioning and competitive analysis. The layout features a 4-quadrant coordinate system with two axes and five circular elements positioned to show relative market positions and value comparisons at a glance. Available in two color versions—blue and pink tones—each slide includes axis labels, title fields, and text areas for immediate data entry. Ideal for marketing strategy presentations, new product positioning, investor pitches, and competitive landscape analysis.
Usage Points
-
Main Usage
Analyze and visualize the relative market position of your company and competitors across two key dimensions. The size and placement of circles represent multiple variables simultaneously—such as market share, price point, or feature strength—enabling clear strategic decision-making.
-
How to Use
Customize the axis labels to reflect your analysis criteria (e.g., Price vs. Quality, Innovation vs. Customer Satisfaction). Enter competitor names in each circle and adjust positions accordingly. Scale circle sizes to represent market share or revenue for more intuitive comparison.
-
Recommended For
Marketing managers, strategy planners, and business development teams presenting competitive analysis and positioning strategies. Suitable for investor presentations, executive briefings, marketing plans, and business proposals—especially the market analysis section.
-
Slide Structure
Each slide contains a 2-axis 4-quadrant coordinate system, five circular elements (one in accent color, four in light tones), three axis label text fields, and legend/description areas. Optimized for 16:9 widescreen format with editable text and shapes.
Related Products
-

Positioning Analysis Graph – Visualizing Market and Competition
#Market and Competitor Analysis #Marketing Plan and Strategy #Graph
-

Space Industry Positioning Map - Visualizing Market Competitiveness
#Market and Competitor Analysis #Marketing Plan and Strategy #Graph
-

Market Distribution Analysis Positioning Map – Strengthening Competitiveness
#Market and Competitor Analysis #Marketing Plan and Strategy #Diagram
-

Competitor Positioning Graph – Diagram for Market Analysis
#Market and Competitor Analysis #Marketing Plan and Strategy #Diagram
